
When researching a company, investors often start by learning about its main products and business, then review its recent financial performance, changes in its financial statements, and market capital flows. The fiisual Taiwan Stock Lab brings together market, industry, and stock information, helping investors move from broad trends to a closer look at individual companies. This article introduces the key features of the fiisual Taiwan Stock Research Lab and shows how to start with industry performance before exploring a company’s operations, financials, and market data.
fiisual Highlights
The fiisual Taiwan Stock Research Lab homepage features an industry heatmap showing price movements across sectors, along with historical index trends and industry articles written by our research team. These tools help investors quickly understand market trends and learn more about the industries behind them.
Company pages provide financial indicators, capital flows, and historical financial statements. Designed with users in mind, fiisual offers an intuitive, easy-to-use experience: click a data point to add it to a chart for comparison, switch quickly between time periods, and pin the latest data fields for easy comparison with historical figures. These interactive features help investors organize information more efficiently and gain a fuller understanding of a company’s operations and financial performance.
fiisual TW Stock Lab: From Market Trends and Industry Performance to Stock Analysis
Use the Industry Heatmap, Market Trends, and Research Insights to Understand the Market
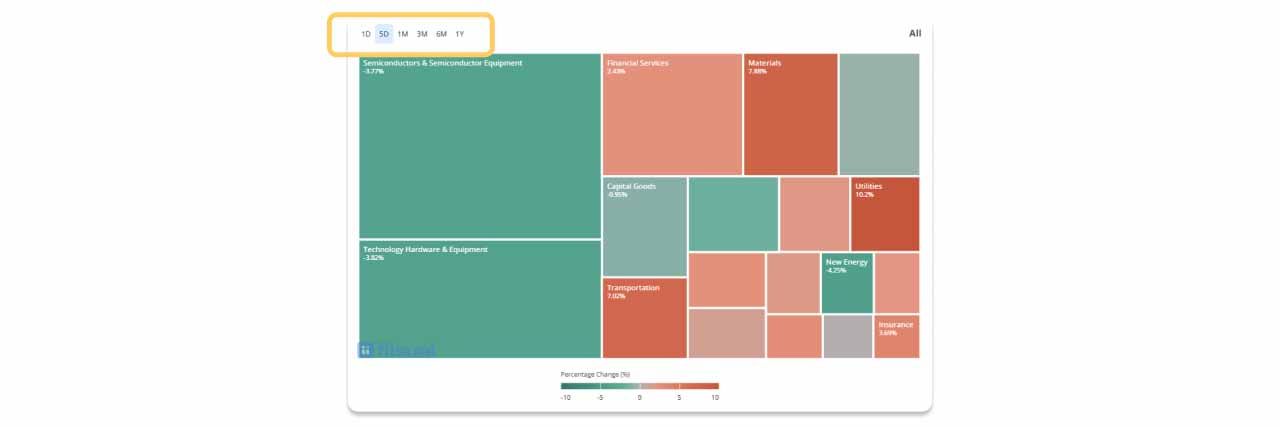
The fiisual TW Stock Lab homepage opens with a heatmap organized by industry. Each tile shows an industry name and its percentage change, making it easy to compare sector performance. You can switch between time periods such as 1 day, 5 days, and 1 month to see how industries have performed over different intervals.
Compare Industry Performance and Identify Differences Among Companies
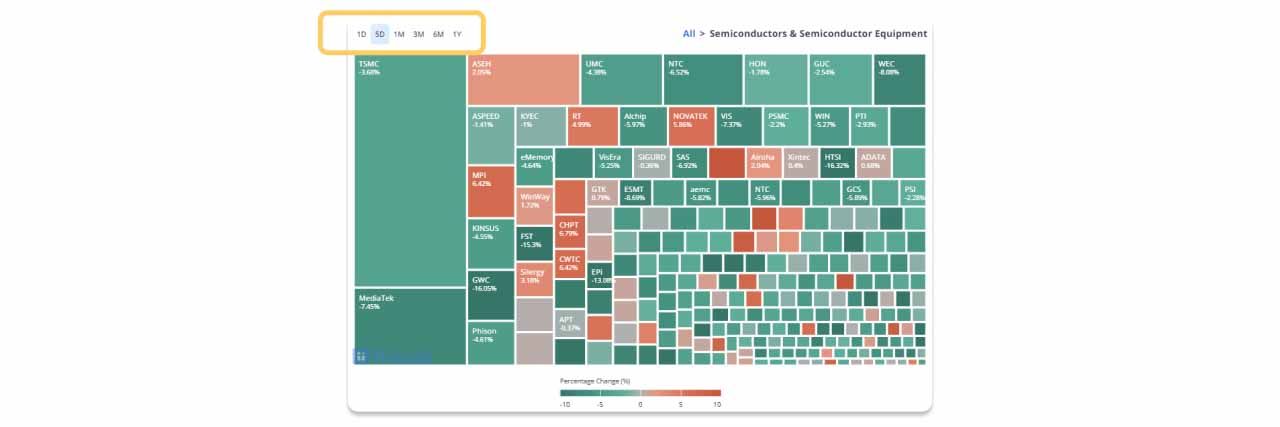
Take “Semiconductors & Semiconductor Equipment” as an example. Select the industry tile on the homepage to view a heatmap of the companies within that industry, including TSMC (2330.TW), UMC (2303.TW), and ASEH (3711.TW). Switch between time periods to compare their relative performance and see whether gains are broad-based or driven by only a few stocks.
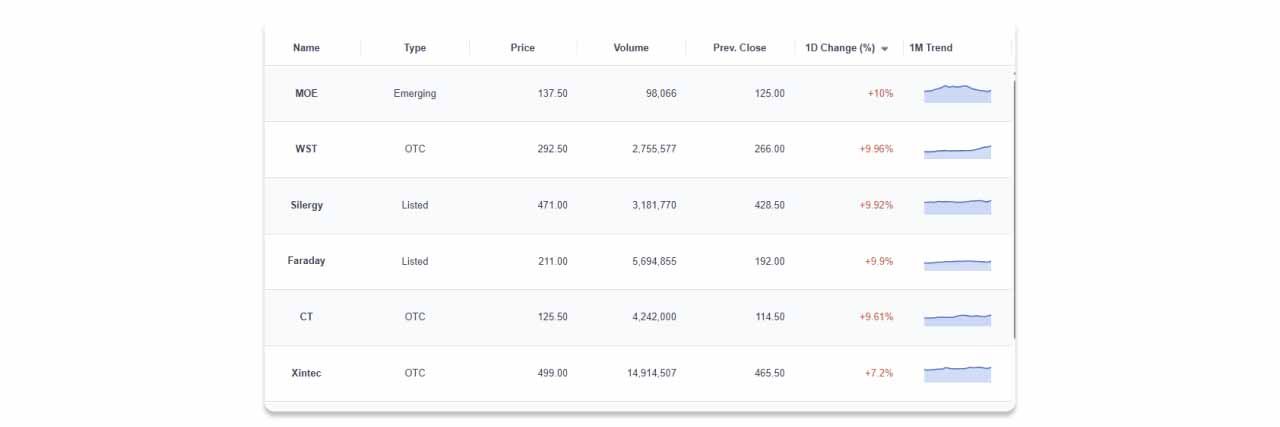
Below the heatmap, a stock list shows each company’s name, listing market, latest price, trading volume, previous close, daily percentage change, and one-month trend. Comparing the figures and trend lines can help investors see whether a stock’s daily move is consistent with its recent performance and identify companies for further research.
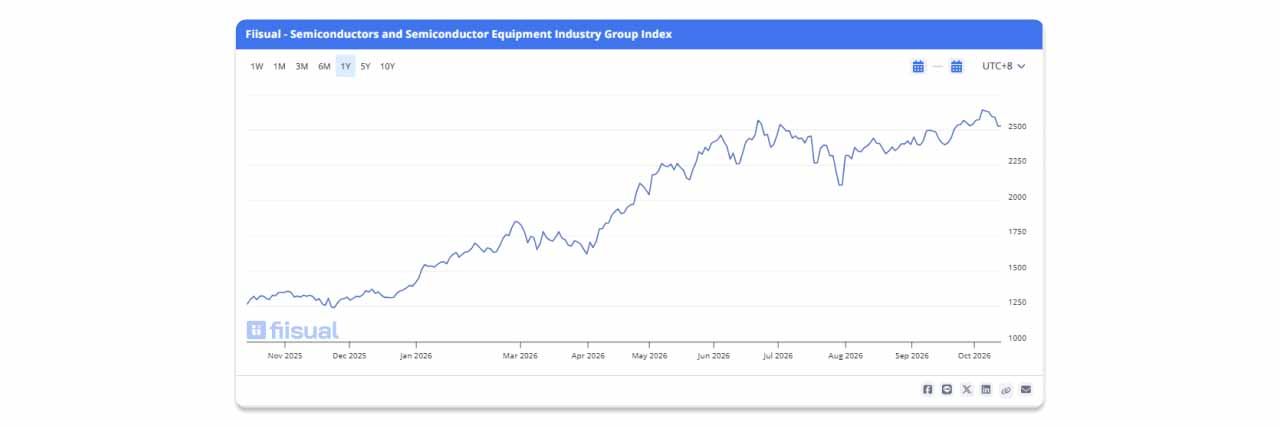
Further down the page, you can view the “fiisual Semiconductor and Semiconductor Equipment and Industry Group Index” and switch between time periods to follow the industry’s overall trend. Related articles below the chart offer additional context on industry and company developments. Stock performance is only a starting point: once you identify a company of interest, visit its company page to review revenue, earnings, and financial condition and assess whether its operating trends support market expectations.
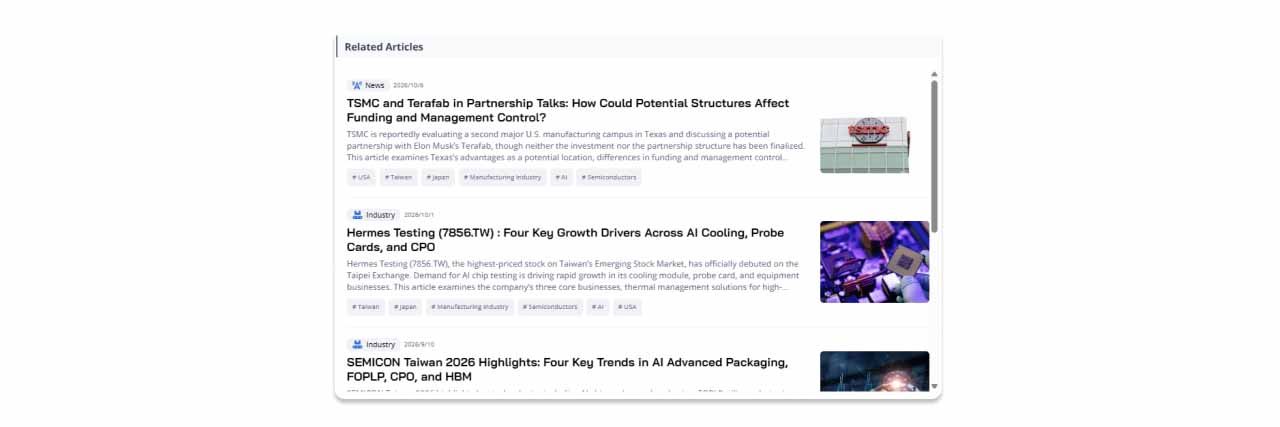
The bottom of the page also features related articles on industry analysis and earnings calls. These help investors understand the industry and operating context behind market data. For example, if a sector is outperforming, industry articles can provide context on product upgrades and changes in supply and demand. For a company of interest, earnings call coverage can help investors understand management’s view of current operations and future prospects.
Find a Stock Quickly
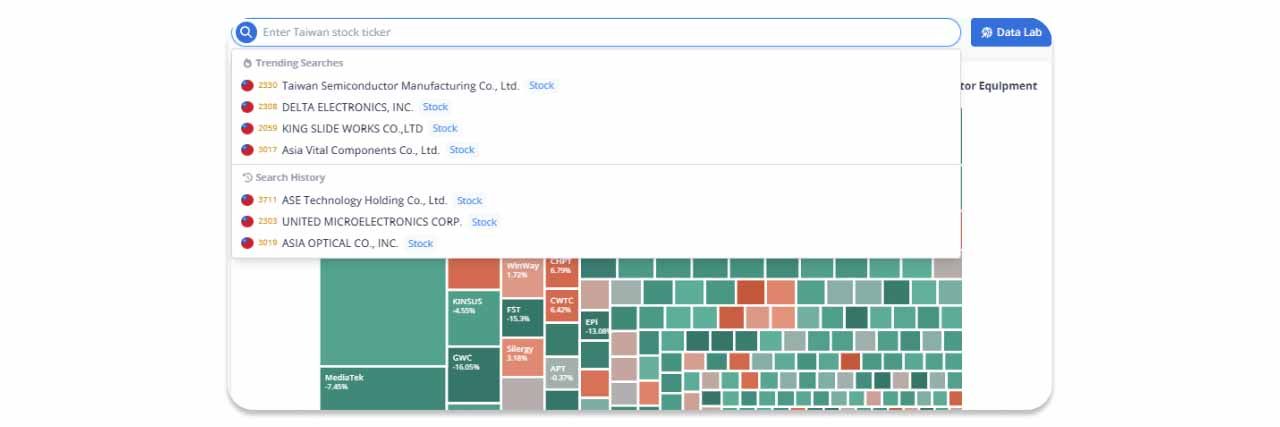
If you already have a company in mind—or have found one through the information above—enter its ticker or name in the search bar at the top of the page. You can then open its company page to review basic information, operating performance, and financial indicators, taking your research from the broader market to an individual stock.
Taiwan Stock Analysis Pages: Operations, Financials, Trading Activity, and News
The following section uses Taiwan Semiconductor Manufacturing Company (2330.TW) as an example to introduce the data and features available on fiisual. In addition to the Overview page, company information is organized into Financial Metrics, Market and Fund Flows, Financial Statements, and News. Investors can use these sections to move from stock performance to a closer look at a company’s operations and financial condition.
Overview
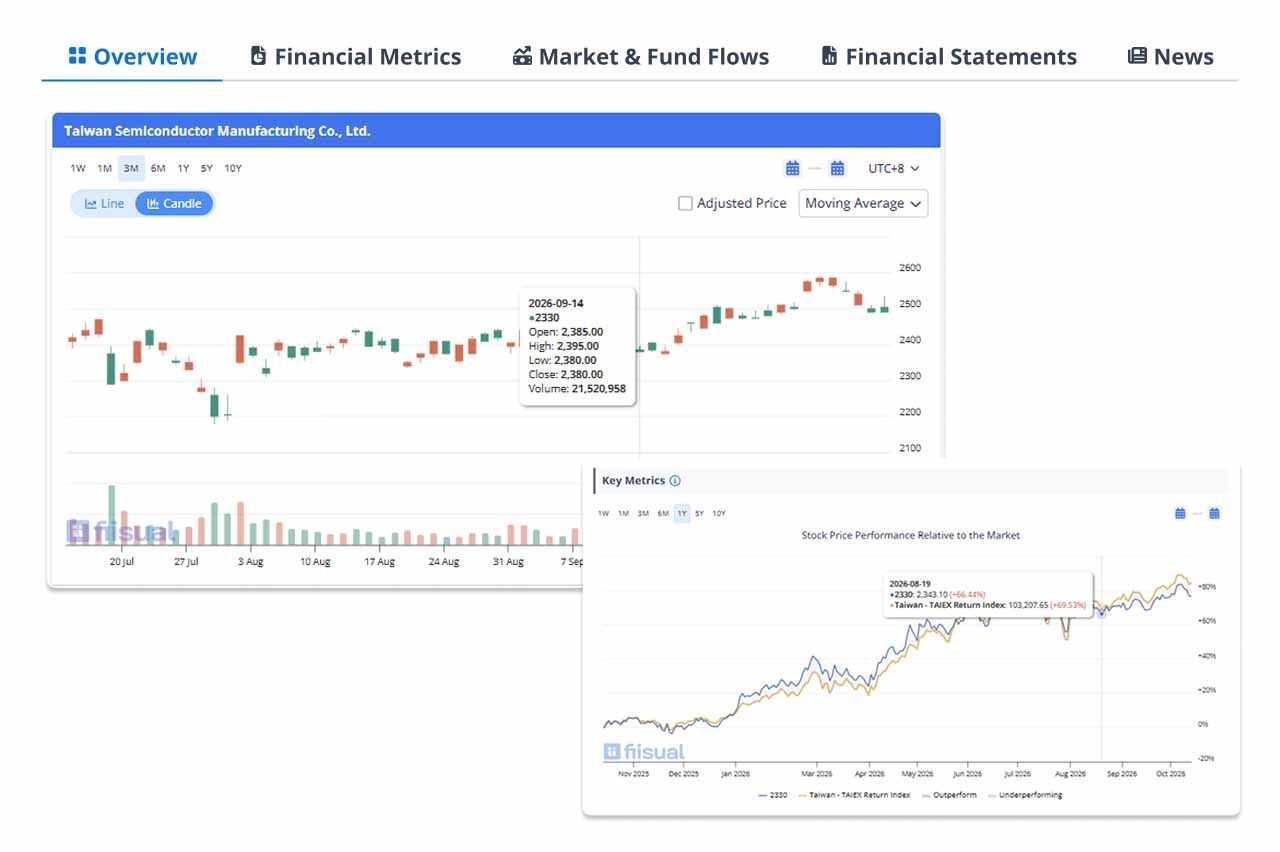
The Overview page shows the stock price, percentage change, trading volume, and historical trend. You can change the time period, switch between a line chart and candlestick chart, and add moving averages to examine price movements. The page also summarizes the company’s basic information, business description, and market capitalization, helping investors quickly understand what the company does and its market size.
The Key Metrics section includes a “Stock Price Performance Relative to the Market” chart, which compares a stock’s performance with the broader market over the same period. It also brings together indicators such as earnings per share (EPS), the price-to-earnings ratio (P/E), return on equity (ROE), and dividend yield to provide an initial overview of the company.
Financial Metrics
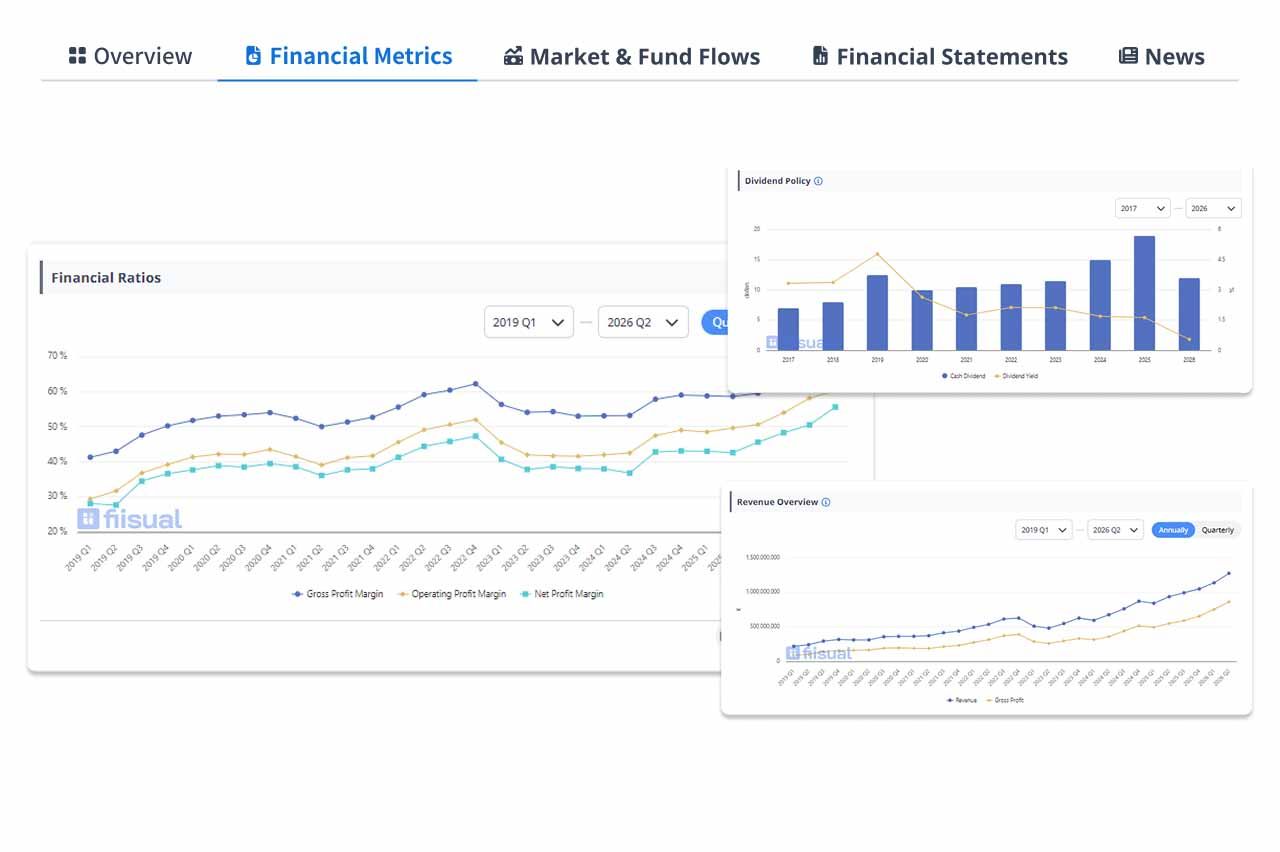
To explore a company’s operating trends in more detail, select “Financial Metrics” to review financial ratios, dividend policy, and revenue overview.
Financial Ratios can be viewed by quarter or year and cover profitability, growth, valuation, operating efficiency, and solvency. For example, if the industry heatmap or Taiwan Stock Dashboard shows revenue growth in the semiconductor sector, you can review TSMC’s revenue and compare it with gross margin, operating margin, and EPS to see whether revenue growth is also reflected in earnings. You can also refer to the P/E and price-to-book (P/B) ratios to observe changes in how the market values the company.
Dividend Policy summarizes historical distributions and provides information such as dividend yield and stock dividends, helping users review the company’s dividend payments.
Revenue Overview brings together operating and earnings indicators, including revenue, gross profit, and net income. Quarterly growth rates and changes over the most recent four quarters make it easier to compare recent results with past performance and identify operating trends.
Market and Fund Flows
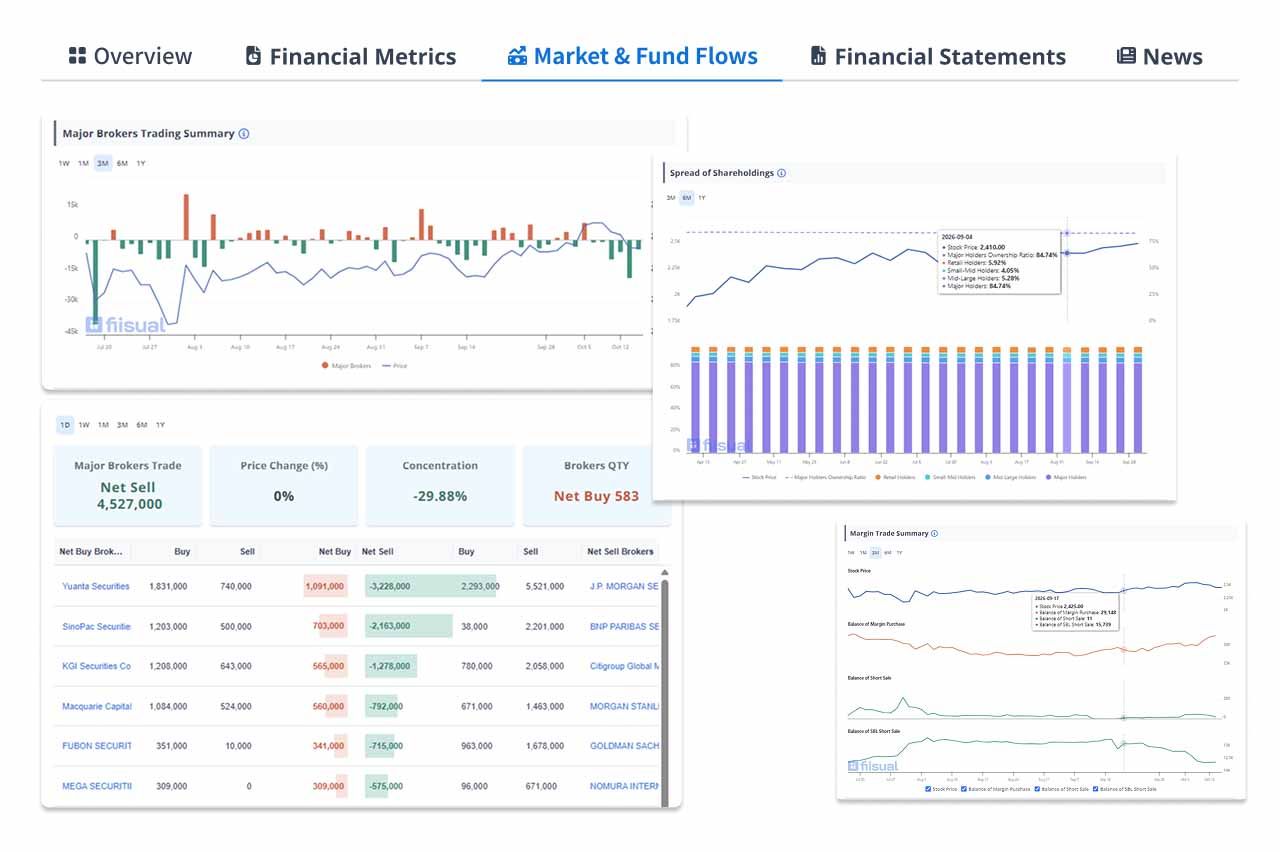
Market and Fund Flows extends the analysis to trading activity and ownership data. It includes institutional investors, major brokers, margin trading, insider holdings, the state-owned banks, and shareholding distribution. Investors can track buying, selling, and ownership changes among different groups and compare them with share price and trading volume.
For example, you can review changes in TSMC’s margin trading activity and gain a closer view of credit trading in the stock.
Financial Statements
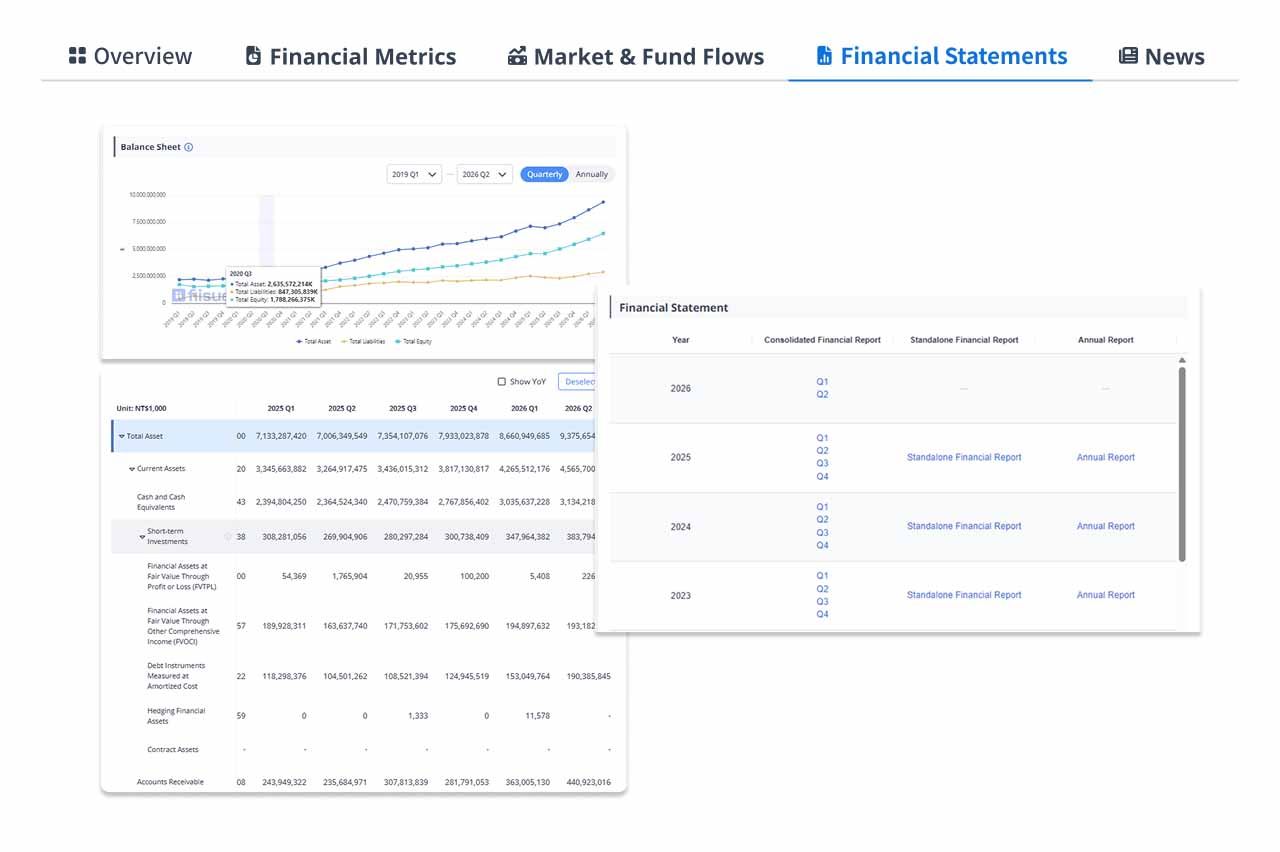
To examine the figures in more detail, select Financial Statements to view the income statement, balance sheet, and cash flow statement. You can also follow the links to review the original source materials. The income statement helps explain revenue, costs, and earnings; the balance sheet shows the structure of assets, liabilities, and shareholders’ equity; and the cash flow statement reflects cash inflows and outflows from operating, investing, and financing activities.
For example, when analyzing TSMC’s capacity expansion, investors can look beyond revenue and earnings growth by reviewing capital expenditures, operating cash flow, and changes in borrowing to understand the expansion’s funding needs and its impact on the company’s financial condition.
News
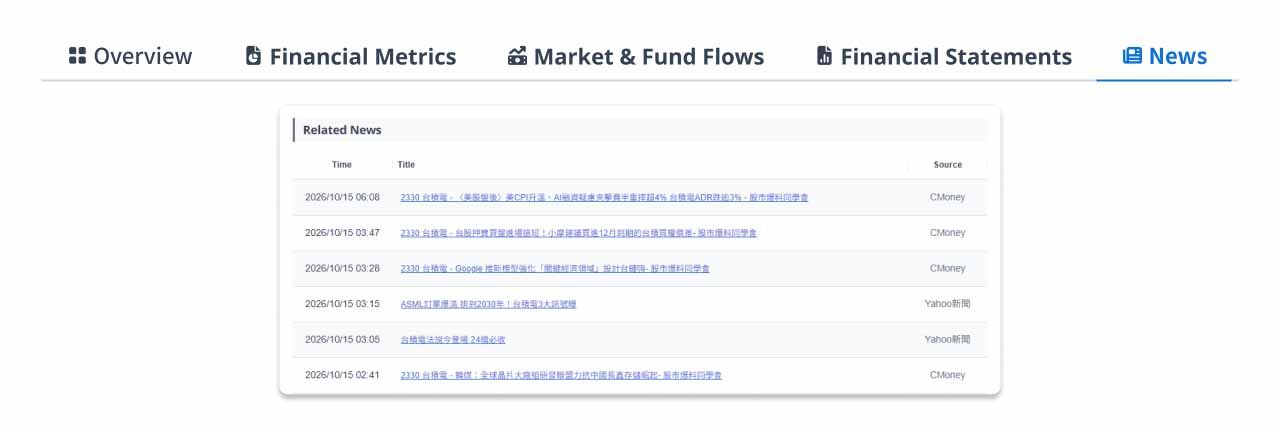
Related News organizes company coverage by date and displays each article’s title and source. When a stock price or financial indicator changes, investors can use relevant reports to understand the operating news and market focus at the time, then return to the financial indicators and statements for ongoing analysis.
After finding a company through the industry heatmap, investors can combine information about its operations, financials, trading activity, and news to build a more complete research picture.
fiisual Taiwan Stock Research Lab Connects Market Data with Company Analysis
The fiisual Taiwan Stock Research Lab brings together market monitoring, industry comparisons, company analysis, and ongoing tracking. It helps investors identify industries worth watching, companies for deeper research, and the questions to follow next. By cross-checking different sources of data, investors can move from market signals to a closer review of a company’s operations, financial condition, and valuation, and update their view as new information becomes available.
| Research area | Features | How they support research |
|---|---|---|
| Market monitoring | Industry heatmap, Industry Index trends, selectable time periods, and industry articles | Track the broader market and sector performance, compare changes over different periods, and use industry context to identify areas for further research. |
| Industry comparison | Heatmaps of stocks within an industry, stock lists, industry group indices, and related articles | Compare the share price and trading performance of companies in the same industry. See whether a trend is broad-based or driven by a few stocks, then narrow the scope of your research. |
| Company analysis | Company overview, financial metrics, market and fund flows, financial statements, and news | Review a company’s revenue, earnings, financial condition, valuation, and trading activity; assess whether industry growth is reflected in its operations; and track developments through related news. |
👉🏼 Ready to explore? Try the Taiwan Stock Research Lab.
