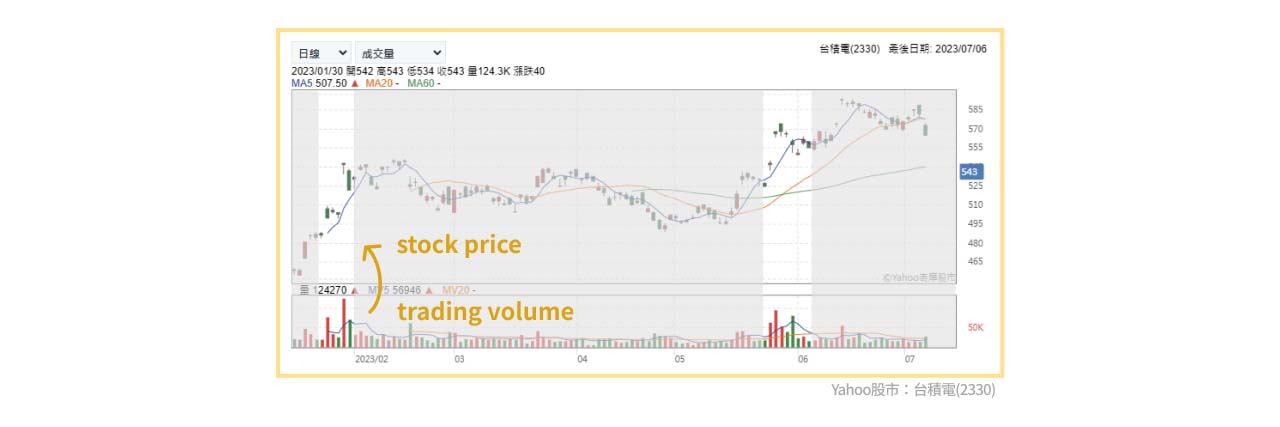
If we consider the stock market as a competitive game between buyers and sellers, then the price is the outcome of their competition, while trading volume represents the intensity of that competition. Some believe that trading volume, being the result of actual transactions, provides more precise trading information compared to order book data.
Changes in the Relationship Between Volume and Price
Here, we would like to share two common market perspectives about the changes in the relationship between volume and price:
- Trading Volume Represents Turnover as Both Bulls and Bears Begin to Position Themselves. When transactions occur in the market, it also indicates that there has been a change in stock ownership. There are many possible reasons: it may be that the new traders have obtained information that the original traders did not have, or it may be that traders are about to make directional moves in the market.
- High Trading Volume Indicates the Presence of Some Private Information has been spreading through trades, leading to Market Equilibrium. Another perspective about stock price and volume is that when significant, non-public information emerges, the market reaches equilibrium through a large volume of transactions. In other words, initially, only a small group of investors may possess the information, but as trading volume increases, it attracts more external attention, leading to further research and aiding in the dissemination of the information.

No matter which perspective is taken, they all agree that there is a significant relationship between volume and price, suggesting that studying this relationship can provide some insights into future market price trends.
For those who are still unfamiliar with trading volume, you can refer to our previous article: What is Trading Volume?
Note: The market described in both perspectives above leans towards the “imperfectly efficient market” theory, which implies that the market does not immediately reflect all available information to investors.
Trading Volume Accompanied by Volatility
Increased Trading Volume in Taiwan Stocks Leads to Higher Price Volatility
By analyzing the historical changes in trading volume, we can see that when trading volume increases, the expected volatility, both on the same day and in the near future, tends to increase as well.
We analyzed trading day data from the past 20 years to observe whether, when the trading volume on a single day exceeds the 5-day average, there is a higher likelihood of significant price volatility on the same day or in the subsequent days.
Here are the actual findings from the study on changes in trading volume and price volatility: Taking the Taiwan Weighted Stock Index as an example, over the past 20 years, the average price change on a single trading day was 0.81%. However, when we only consider trading days where the volume increased (i.e., single-day trading volume exceeded the 5-day average), the average price change on those days rose to 0.99%.
Calculation method: The price change is calculated by taking the absolute value of the daily price fluctuations, excluding the direction.
Increased Trading Volume May Indicate Future Price Volatility
Further analysis shows that if trading volume increases on a single day, there is a more than 2/3 chance of greater price fluctuations within the next 3 trading days. If the observation period is extended to 5 days, this probability increases to 77%. This implies that when trading volume increases, its impact on price volatility may not be limited to that day but could extend to the following few trading days.
Similar Phenomenon Observed in U.S. Stock Indexes
This phenomenon is not exclusive to Taiwan stocks. We also back-tested other U.S. stock indexes and obtained similar data and results. The three major U.S. stock indexes—S&P 500, Nasdaq, and Dow Jones Industrial Average—all show greater price fluctuations on days with increased trading volume, with more than half the probability of observing even larger fluctuations within the next 3 to 5 trading days.
Conclusion
Changes in Trading Volume May Indicate Future Price Trends
For traders, there may be a stronger desire to find clues about future price trends from changes in trading volume. A group of traders in the market focuses on analyzing the relationship between changes in trading volume and price changes, using at least four different patterns: price increases with volume increases, price decreases with volume increases, price increases with volume decreases, and price decreases with volume decreases.
