Changes in liquidity are one of the key factors influencing the market—simply put, it refers to the flow of funds within the financial system. When liquidity is insufficient, borrowing becomes more difficult, further restricting financing and market activities. Conversely, when liquidity is abundant, more capital enters financial markets, driving up asset prices such as stocks and real estate. Therefore, monitoring liquidity trends helps identify the fundamental drivers behind asset price movements.
The world's largest liquidity creator is the U.S. Federal Reserve. Recently, concerns have emerged regarding a potential shift toward tighter liquidity in the market. This raises the question of whether the Fed will pause its balance sheet reduction (quantitative tightening) in 2025. Below, we will guide you through how to analyze liquidity signals using the Fed’s H.4.1 weekly balance sheet report.
| Assets | Liabilities/Equity |
|---|---|
| Securities: U.S. Treasuries, Federal Agency Securities, MBS | Bank Reserves |
| Loans: Discount Window, BTFP, PPPLF | U.S. Treasury General Account (TGA) |
| Repurchase Agreements (Repo) | Overnight Reverse Repurchase Agreements (ON RRP) |
| Central Bank Liquidity Swaps |
Assets: Where the Money Goes
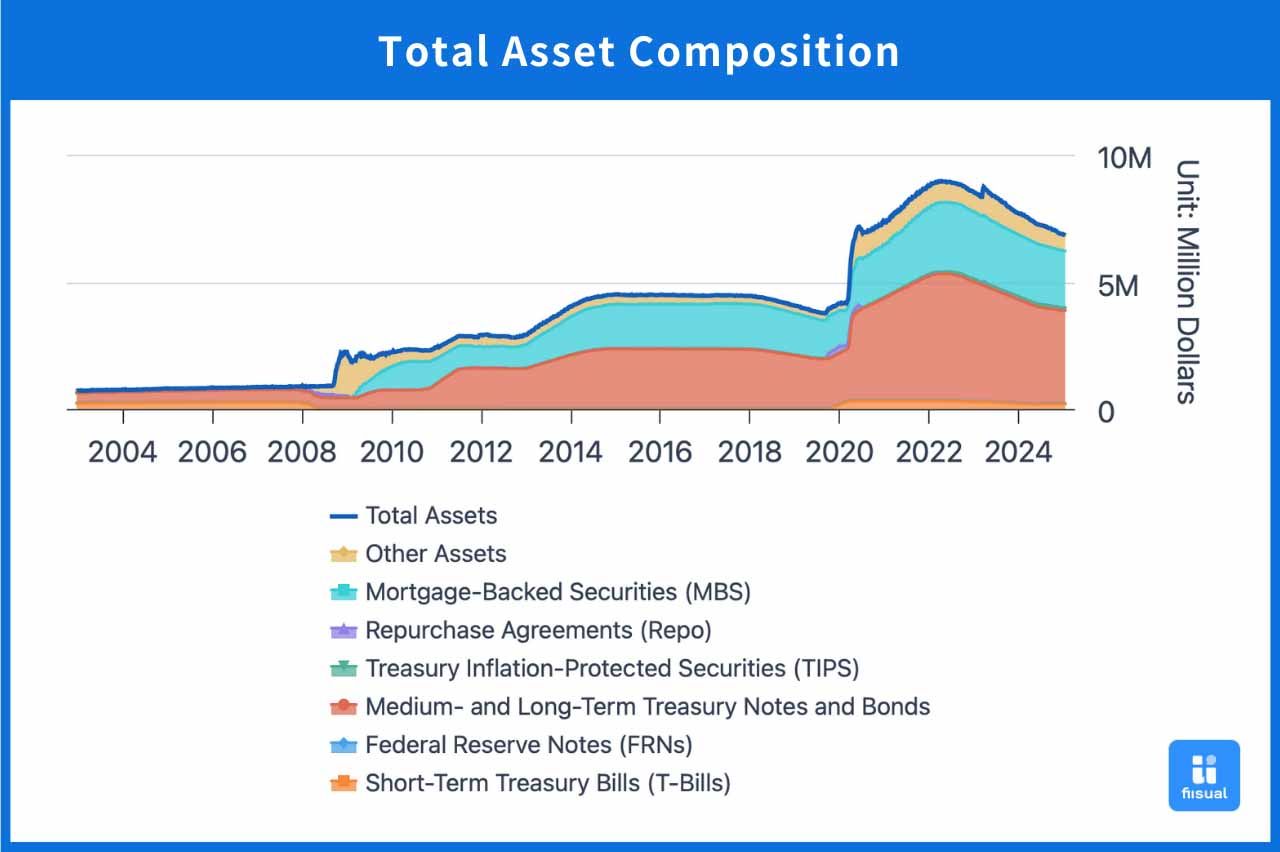
The asset side of the Fed’s balance sheet represents how funds are deployed, including securities purchases, loans to depository institutions, repurchase agreements, and central bank liquidity swaps. Each of these mechanisms serves a different purpose in injecting liquidity into the financial system.
Securities (Securities Held Outright)
Over 80% of the Fed’s balance sheet is allocated to securities, primarily medium- to long-term U.S. Treasuries and mortgage-backed securities (MBS). This is one of the Fed’s primary methods of injecting liquidity into the economy. Changes in holdings can be tracked through Federal Open Market Committee (FOMC) meetings. For example, in December, the Fed announced a monthly reduction of $25 billion in Treasuries and $35 billion in MBS, signaling continued liquidity withdrawal from the economy.
| Security Type | Description |
|---|---|
| U.S. Treasuries | Short-term bills (<1 year), medium-term notes (2–10 years), long-term bonds (>10 years), and Treasury Inflation-Protected Securities (TIPS) |
| Federal Agency Securities | Direct debt from government-sponsored enterprises (e.g., Fannie Mae, Freddie Mac, FHLB) |
| MBS | Mortgage-backed securities |
Loans
Depository institutions generally avoid borrowing from the Fed unless absolutely necessary, as market participants may perceive such borrowing as a sign of financial weakness. A sharp increase in loan usage could indicate stress in financial markets and liquidity constraints.
- Discount Window: Provides emergency lending to banks, categorized into three types—Primary Credit (for solvent institutions), Secondary Credit (for less creditworthy institutions), and Seasonal Credit (for small banks with seasonal funding needs). An increase in borrowing here is a red flag for liquidity stress.
- Bank Term Funding Program (BTFP) & Paycheck Protection Program Liquidity Facility (PPPLF): Emergency tools introduced in times of crisis. For example, BTFP was created to address the fallout from the collapse of Silicon Valley Bank, while PPPLF provided liquidity to banks issuing small business loans during the COVID-19 pandemic. The pace at which these tools are phased out can indicate the speed of liquidity tightening.
Repurchase Agreements (Repo)
The Fed operates the Standing Repo Facility (SRF), allowing financial institutions to exchange U.S. Treasuries for reserves at a fixed rate. This helps mitigate the risk of forced selling of Treasuries and provides short-term liquidity.
- FIMA Repo Facility: A version for foreign central banks, which provides short-term dollar funding.
- If repo usage rises significantly, it could signal tightening liquidity conditions.
Central Bank Liquidity Swaps
The Fed provides foreign central banks with short-term U.S. dollar funding (ranging from overnight to three months) in exchange for foreign currency. A sudden increase in swap usage could indicate U.S. dollar liquidity shortages in global markets, serving as a key indicator of financial stress outside the U.S.
Liabilities: Where the Money Comes From
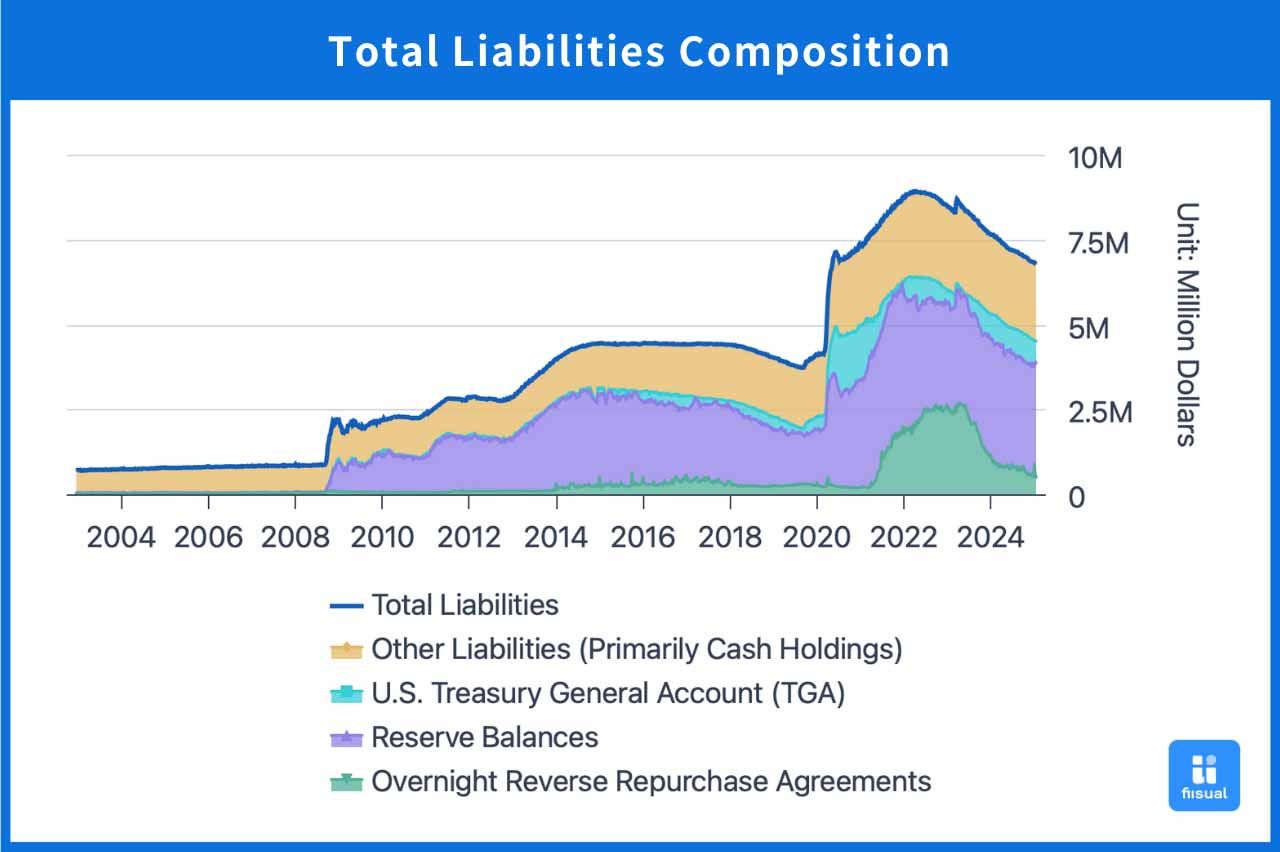
Overnight Reverse Repurchase Agreements (ON RRP)
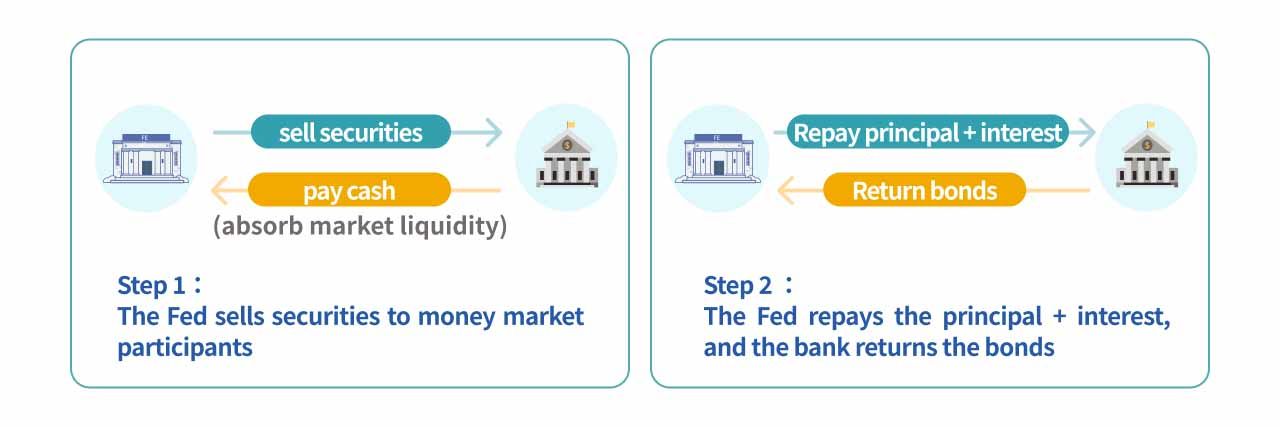
Through ON RRP, the Fed sells securities to money market participants (including money market funds, government-sponsored enterprises, and banks) and repurchases them the next day. This effectively allows institutions to park excess cash at the Fed for a risk-free return.
- Rising ON RRP usage suggests excess liquidity in the market, implying investors are uncertain about where to allocate funds.
- Declining ON RRP usage suggests decreasing liquidity, as funds are moving back into the broader financial system.
U.S. Treasury General Account (TGA)
TGA is the U.S. Treasury’s primary operating account at the Fed, used for managing government cash flows.
- TGA increases when the Treasury issues new debt, pulling liquidity out of the banking system.
- TGA decreases when the government spends, injecting liquidity back into the system.
Bank Reserves
Reserves are the cash balances that banks hold at the Fed.
- Higher reserves typically occur during periods of quantitative easing (QE).
- Lower reserves often accompany quantitative tightening (QT), reflecting improved economic conditions and increased investment opportunities.
Key Liquidity Indicators
Based on the previous analysis, we listed three key liquidity indicators to monitor as below. By tracking ON RRP and TGA trends, we can assess reserve levels and evaluate liquidity supply in the market. Additionally, by analyzing the IORB-SOFR and IORB-EFFR spreads, we can gauge the supply and demand dynamics in the funding market, providing insights into overall liquidity conditions.
Indicator 1: ON RRP Usage
ON RRP Declining to $120 Billion
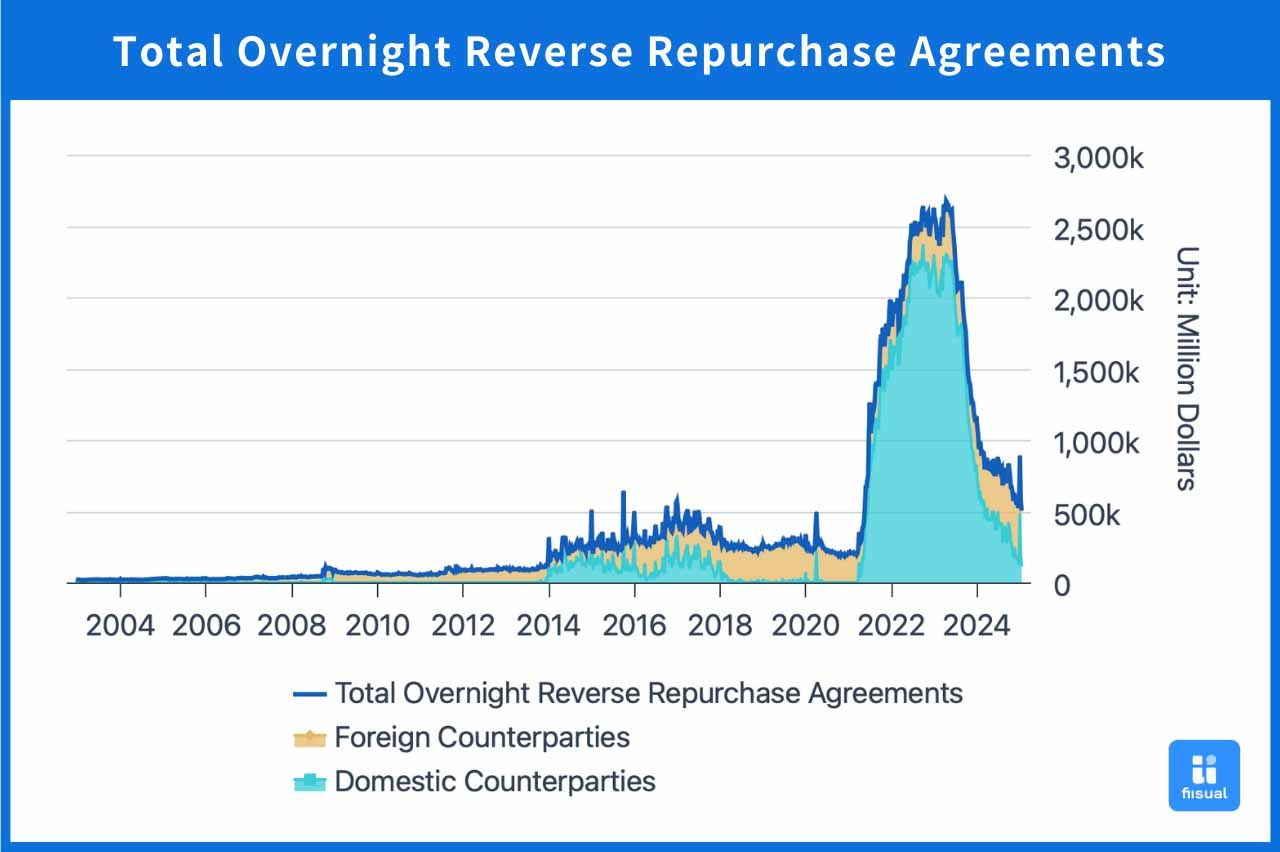
ON RRP usage serves as a gauge of market liquidity. Recent figures show U.S. domestic usage falling to $120 billion, prompting market discussions. However, this decline is primarily due to lower ON RRP interest rates and attractive bond yields drawing funds away, rather than a clear signal of liquidity shortage.
Indicator 2: Reserves/GDP Ratio
Transitioning from Excess to Sufficient Levels
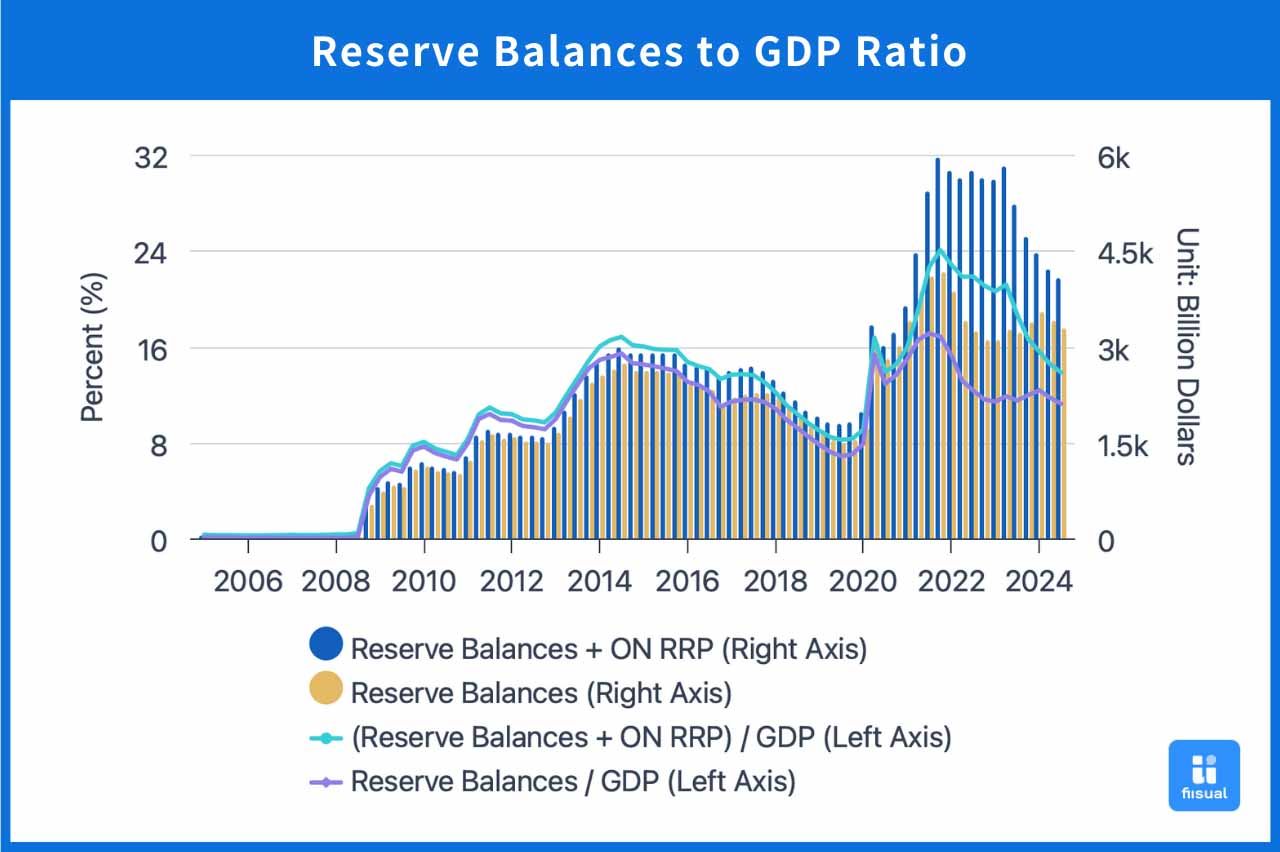
As of Q3 2024, the reserves-to-GDP ratio has dropped to 11.2%. Based on historic experiences: above 10% indicates excess liquidity; 8%-10% would be considered as adequate liquidity, and below 8% usually suggest tight liquidity conditions.
Given that (1) ON RRP usage is declining, (2) there are no signs of increased government spending, (3) the Fed continues reducing its balance sheet by $60 billion per month, and (4) GDP growth remains strong, the reserve-to-GDP ratio is expected to decline further, reaching the adequate liquidity range this year.
If this downward trend persists, the Fed may consider ending quantitative tightening (QT) in 2025, signaling a potential shift toward easing liquidity conditions.
Indicator 3: IORB-SOFR & IORB-EFFR Spreads
Narrowing Spreads Indicate Liquidity Stress
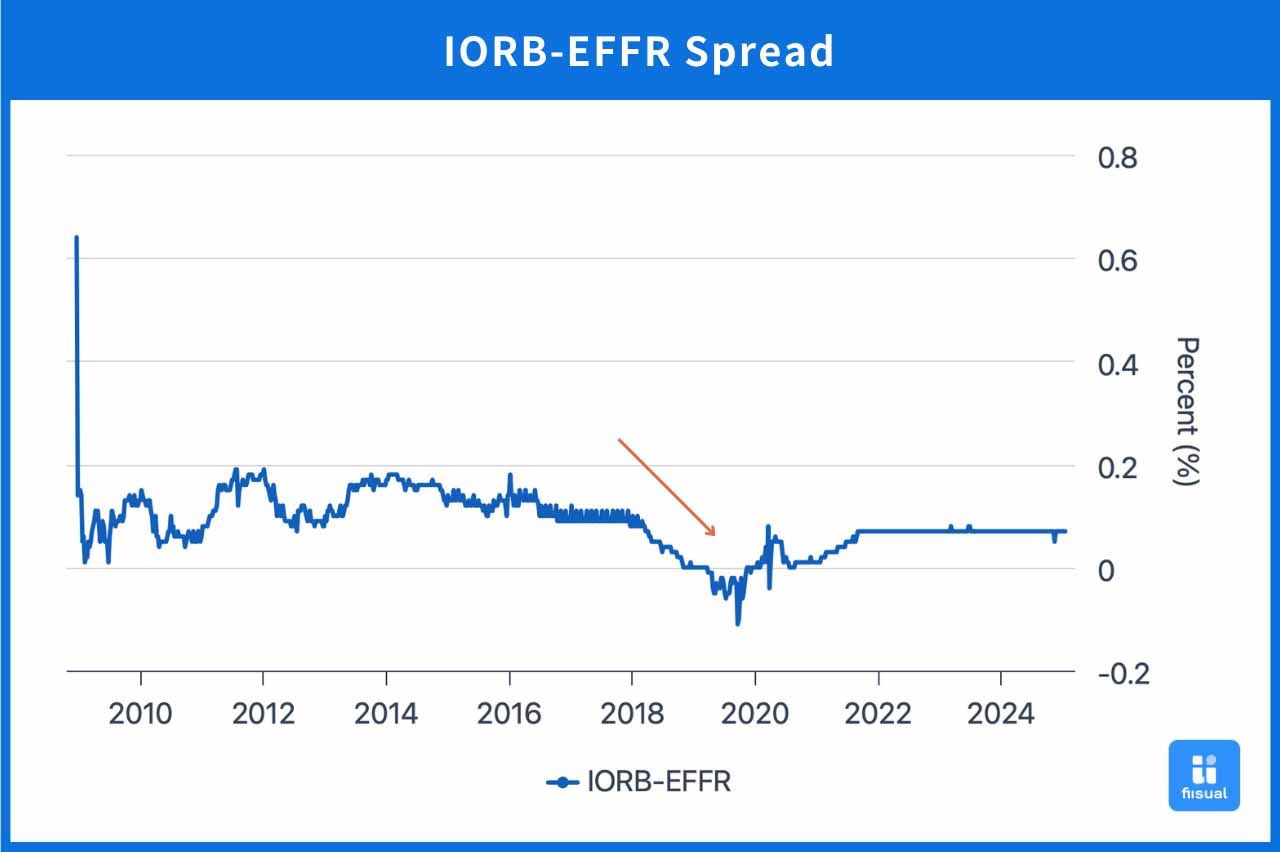
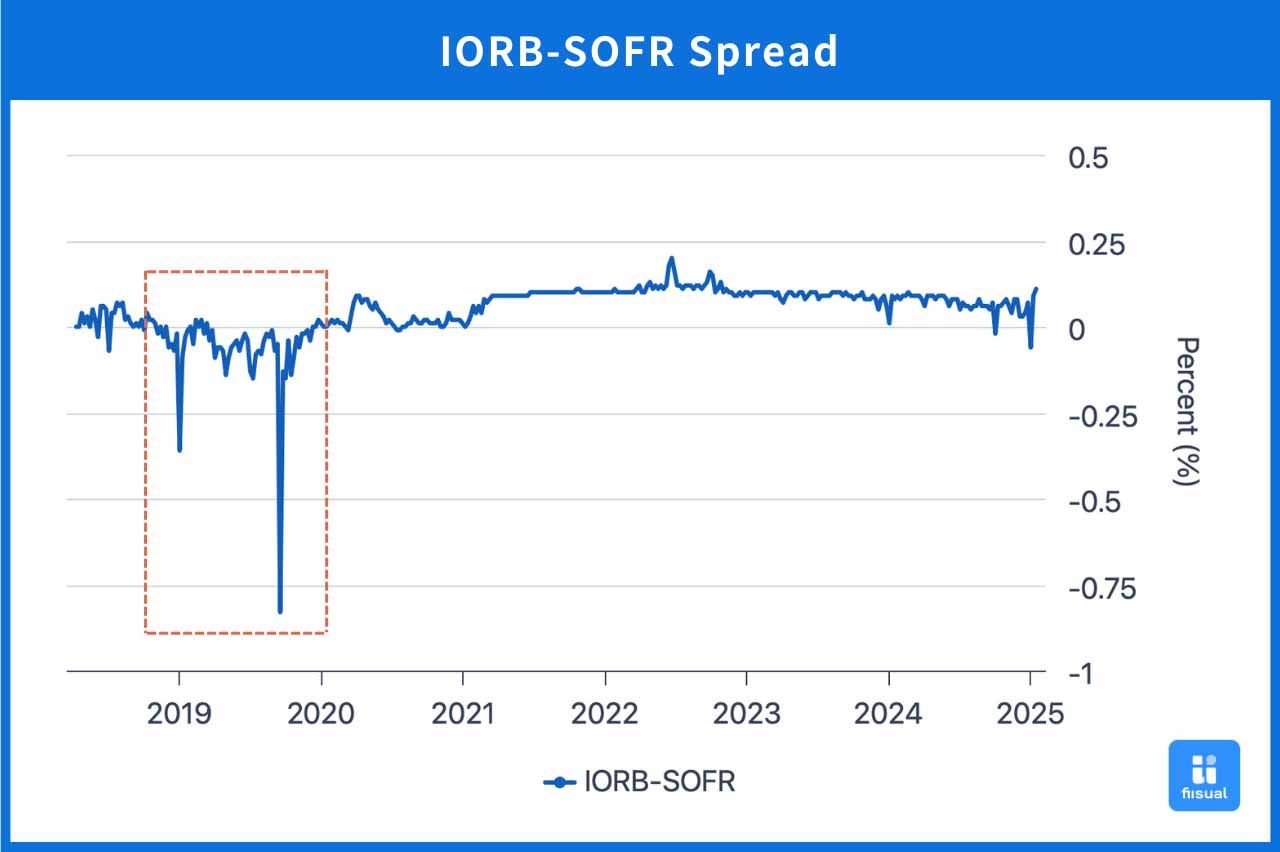
Interest rates reflect the equilibrium of the money market, influenced by factors such as reserve supply shortages or increased demand for funds. If spreads narrow, it becomes more difficult to borrow money, signaling tightening liquidity. For example, in 2019, the spread contracted and even turned negative, triggering a repo market crisis. Therefore, if we observe increased volatility in the IORB-SOFR spread or a narrowing IORB-EFFR spread, it indicates rising liquidity risks.
EFFR (Effective Federal Funds Rate): The unsecured overnight lending rate among U.S. commercial banks in the federal funds market. The rate fluctuates based on supply and demand from depository institutions, meaning each bank may have a slightly different borrowing rate.
SOFR (Secured Overnight Financing Rate): The overnight lending rate secured by U.S. Treasury collateral in the repo market. Since Treasuries serve as collateral, SOFR is often considered a risk-free rate and represents a key funding cost for banks. Banks use their Treasuries as collateral to borrow from other financial institutions, agreeing to repurchase them later at a set rate—this rate is SOFR.
