In the article Financial Report 101: Introduction to the Income Statement, we introduced the relationship between a company’s revenue and final profit, and the difference between COGS and expenses. Now, continuing with the theme of profitability, we’ll take a closer look at Earnings Per Share (EPS) and its significance in investment.
What is Earnings Per Share (EPS)
Earnings Per Share (EPS) is often used to measure a company's profitability, representing how much profit the company earns for each share. The concept of EPS is important because it shifts the focus from total profit to the profit earned per share, allowing investors to better compare companies of different sizes.
For example, if Company A and Company B are vastly different in size, their total profits may not be directly comparable. Company A is older, has more outstanding shares (larger capital), and higher net earnings. Company B is younger, with fewer shares and lower earnings.
| Company A | Company B | |
|---|---|---|
| Net Profit | $10 million | $0.5 million |
| Outstanding Shares | 10 million shares | 0.1 million shares |
| Earnings Per Share | 1 | 5 |
In this example, even though Company A’s net profit is much higher than Company B's, its EPS is lower because of the larger number of shares. EPS makes it easier for investors to compare the profitability of different companies, regardless of the company size. In general, a higher EPS means investors can expect higher earnings for each share they own.
How to Calculate EPS
Basic EPS Formula
EPS can be calculated in different ways depending on the context, but the basic principle remains the same: dividing profit by the number of shares.
The most basic formula for EPS is: EPS = Net Income after tax / Outstanding Shares
- Net income after tax is the company’s profit after subtracting costs, expenses, and taxes.
- Outstanding shares refer to the number of shares available for public trading, excluding treasury stock and restricted shares.
This formula is commonly used and straightforward for most investors. However, for more accuracy, companies often use the following formula, especially in financial reports:
EPS = (Net Income After Tax - Preferred Dividends) / (Weighted Average Outstanding Shares)
- Preferred dividends are subtracted because preferred shareholders have priority in receiving dividends.
- Weighted average outstanding shares accounts for changes in the number of shares during the year due to events like new stock issuance or share buybacks.
Check out more detail comparison between common and preferred shares in A must-read for stock market beginners! How to navigate the vast stock market: Five common stock classification methods

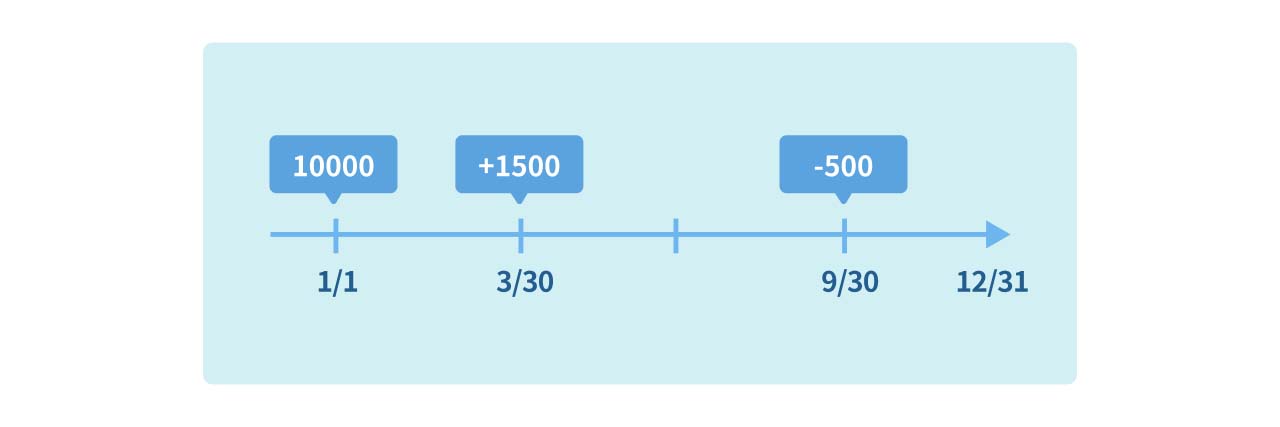
For Example: On January 1st, company A starts the year with 10,000 outstanding shares. On March 30th (3 months later), the company issues 1,500 new shares. On September 30th (6 months later), the company buys back 500 shares. If Company A’s net profit is $120,000 and preferred dividends are $10,000, the EPS would be calculated as follows:
- Weighted average shares outstanding = 11,000 shares [10,000 × 3/12 + (10,000 + 1,500) × 6/12 + (10,000 + 1,500 - 500) × 3/12 = 11,000]
- EPS = $10 [(120,000 - 10,000) ÷ 11,000 = 10]
Now that we’ve covered the definition and calculation of EPS, let’s look at an example from a real-world company.
Example: Amazon’s EPS
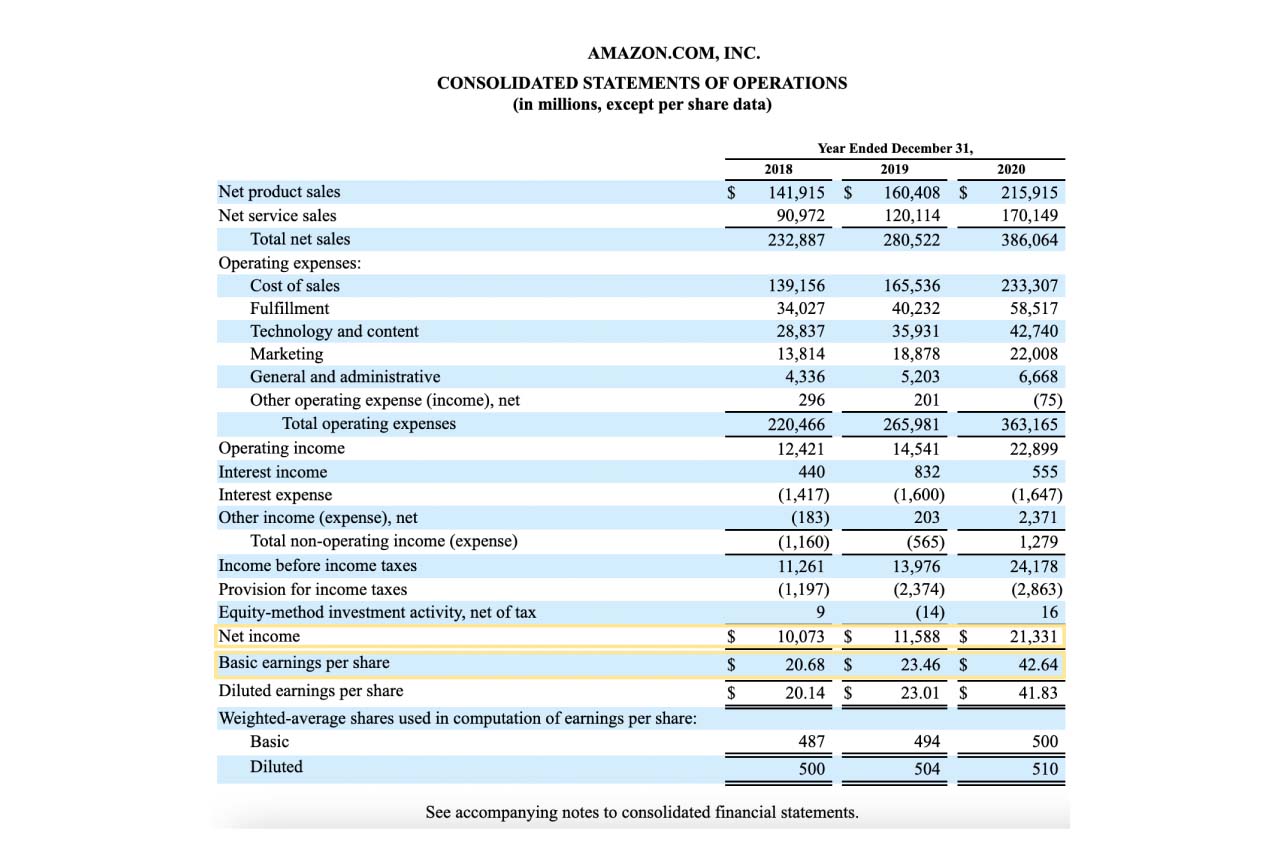
Here’s an example from Amazon’s financial reports:

Between 2018 and 2020, Amazon's weighted average outstanding shares barely changed, increasing from 487 million to 500 million shares. However, due to the surge in demand for e-commerce and cloud services driven by the COVID-19 pandemic in 2020, Amazon’s net income almost doubled. As a result, EPS skyrocketed from $20.68 in 2018 to $42.64 in 2020, despite minimal change in the number of shares.
Key Considerations for EPS
1. Horizontal and Vertical Comparison
Horizontal: Comparing EPS Across Companies
Within the same industry, companies may have similar product lines and offerings. Horizontal comparison of EPS allows investors to evaluate the profitability of different companies over the same period. Generally, a higher EPS suggests that the company is more profitable, which may attract more investors.
Vertical: EPS Growth Over Time
EPS isn’t just a snapshot—it’s important to observe growth over time. An increase in EPS year over year indicates improvements in profitability. Whether due to better gross profit (improved product mix) or more efficient operations (lower expenses), EPS growth is a positive sign for investors.
2. Impact of Share Quantity
Changes in the number of shares can significantly impact EPS. Since EPS depends on both profit and outstanding shares, a company can manipulate EPS by adjusting its share quantity. For example, reducing the number of shares through a stock buyback can increase EPS even if the company’s profit remains unchanged.
3. EPS Doesn’t Always Reflect Dividend Distribution

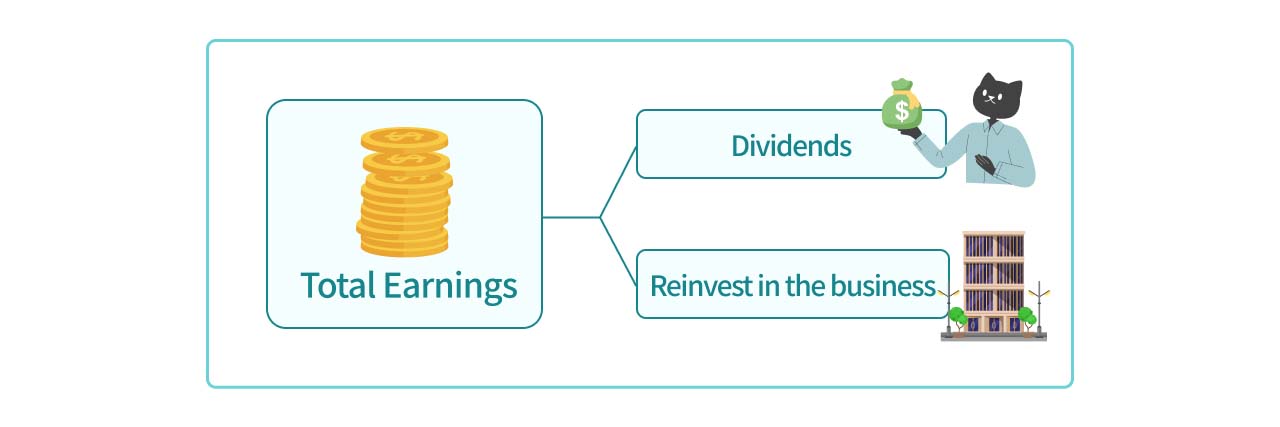
EPS represents how much profit is earned per share, but it doesn’t necessarily indicate how much will be distributed as dividends. Companies often prefer to retain a portion of earnings to reinvest in the business rather than distributing all profits as dividends. Thus, EPS and dividends are not directly correlated.
4. Monitor the Relationship Between Stock Price and EPS
| EPS Unchanged | EPS Rising | |
|---|---|---|
| Stock Price Unchanged | - | Possible investment value |
| Stock Price Rising | Risk of overpaying | - |
The relationship between stock price and EPS is crucial. If EPS remains flat while the stock price rises, it suggests investors may be overpaying for the stock (potentially risky). On the other hand, if EPS is rising but the stock price remains unchanged, it might signal an opportunity for investors to buy at a relatively lower price.
In conclusion, EPS is an essential indicator for investors to assess a company’s profitability on a per-share basis. Understanding how it is calculated, what influences it, and how to use it in analysis can help investors make more informed decisions.
After understanding earnings per share (EPS), you might also want to learn about another commonly discussed financial metric: Financial Report 101: Price-to-Earnings Ratio (P/E Ratio)
