We briefly introduced dividends in our article A must-read for stock market beginners! What are dividends?, but how can you determine the true return from holding a stock based on its price?
What is Adjusted Stock Price?
Before diving into this topic, let’s first review how dividends work:
Dividends are the company’s way of returning profits to shareholders in the form of cash or stock.
For investors, the ex-dividend process converts the intrinsic value of the stock into cash. Overall, the investor’s profit remains unchanged. Therefore, if you only look at the historical price chart after the ex-dividend date, you wouldn’t be able to see the true return of investing in that stock. When a company consistently distributes dividends, the return based on the “unadjusted price” would be lower than the actual return an investor receives.
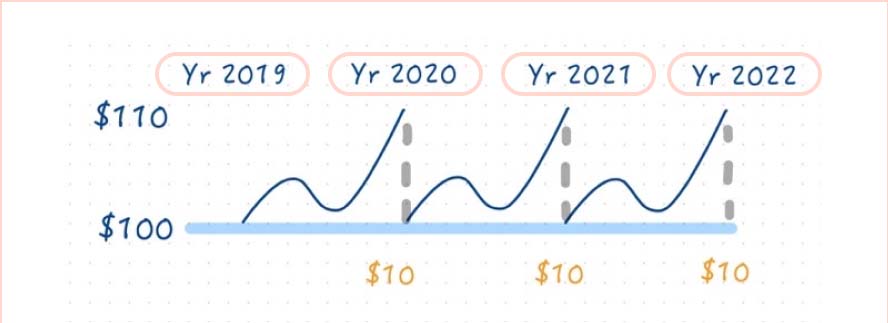
In the example above, if we only consider the stock price, which remains unchanged over three years (from $100 to $100), the price return appears to be 0%. However, in reality, the investor received dividends during this period, meaning there was an actual profit. To solve this problem, we therefore have the idea of “adjusted stock price”.
Using Adjusted Stock Price to See True Investment Returns
The purpose of adjusted stock price is to clearly show the investment performance and return on a historical price chart. To achieve this, we can choose either the “forward” or “backward” adjustment method.
To calculate the adjusted stock price, follow these steps:
- Step 1: Calculate the return for each period.
- Step 2: Choose the adjustment direction: "forward" or "backward."
- Step 3: Ensure the total return remains consistent across periods.
Here’s an Example Calculation:
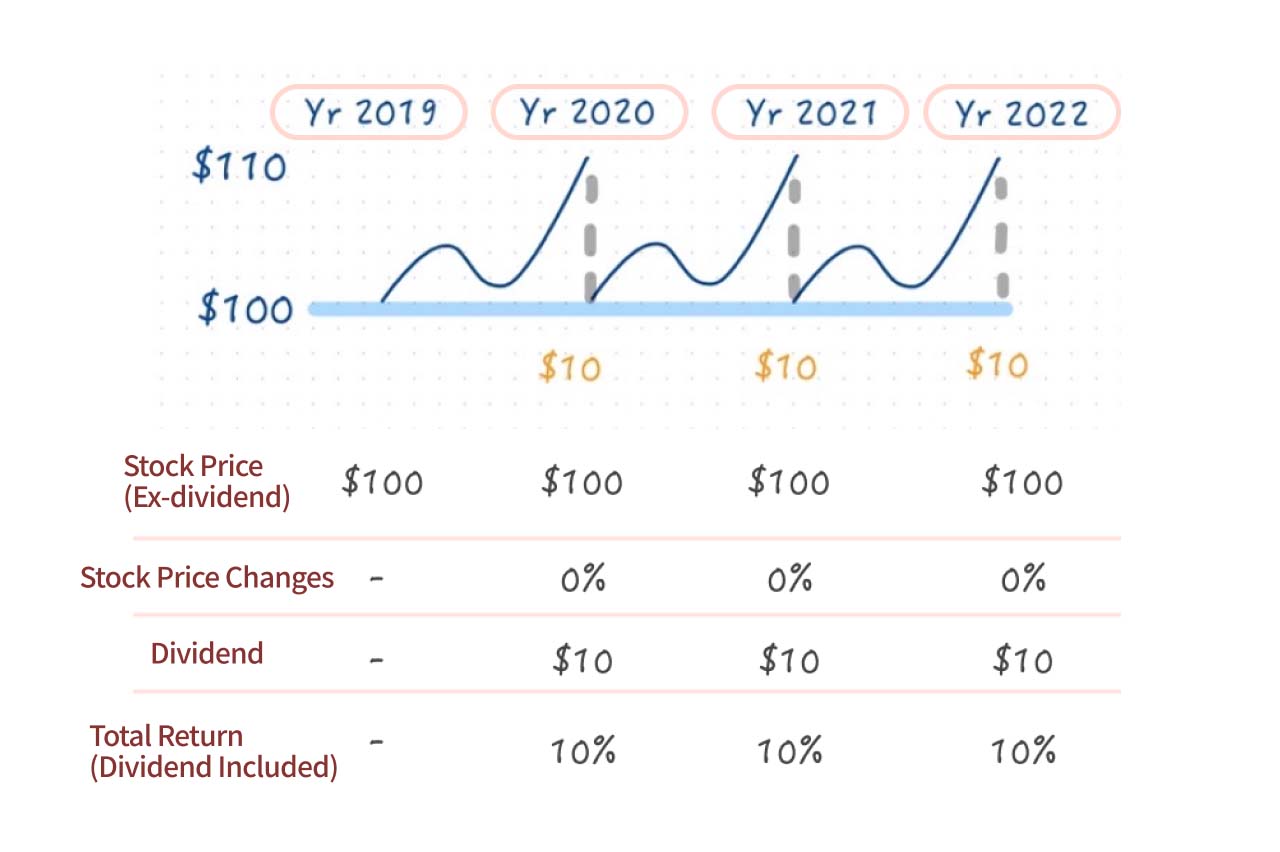
Step 1: Calculate the return for each period. In this example, the stock price remains flat (from $100 to $100), so the total return for each year equals the dividend yield: $10 ÷ $100 = 10%.
Step 2: Choose the adjustment direction. You can opt for either "forward" or "backward" adjustment. Since "forward" adjustment preserves the most recent price information, it is the most commonly used method when you see adjusted price charts.
Step 3: Ensure the total return remains consistent across periods.
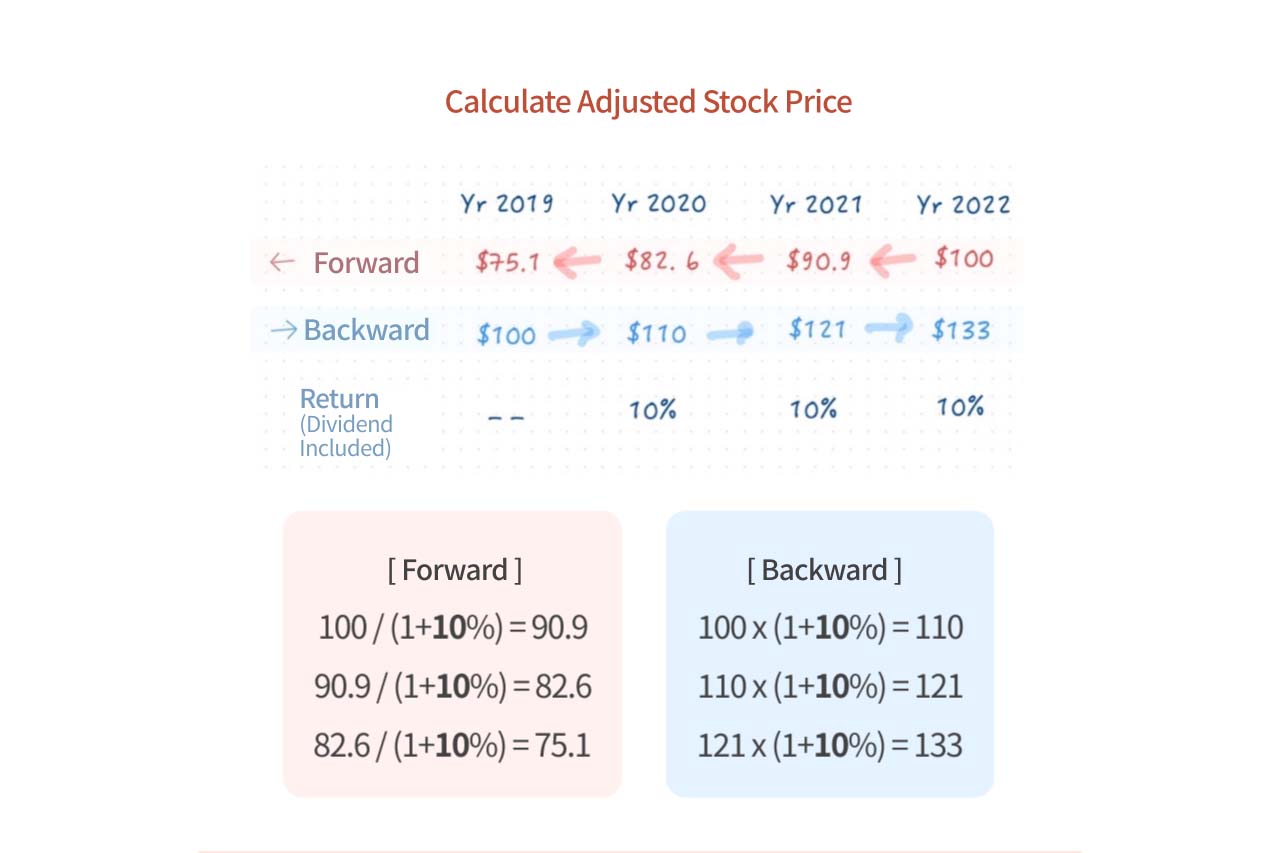 Using the previously calculated total return of 10%, you can calculate the adjusted stock price for either the "forward" or "backward" method.
How to Find Adjusted Stock Prices?
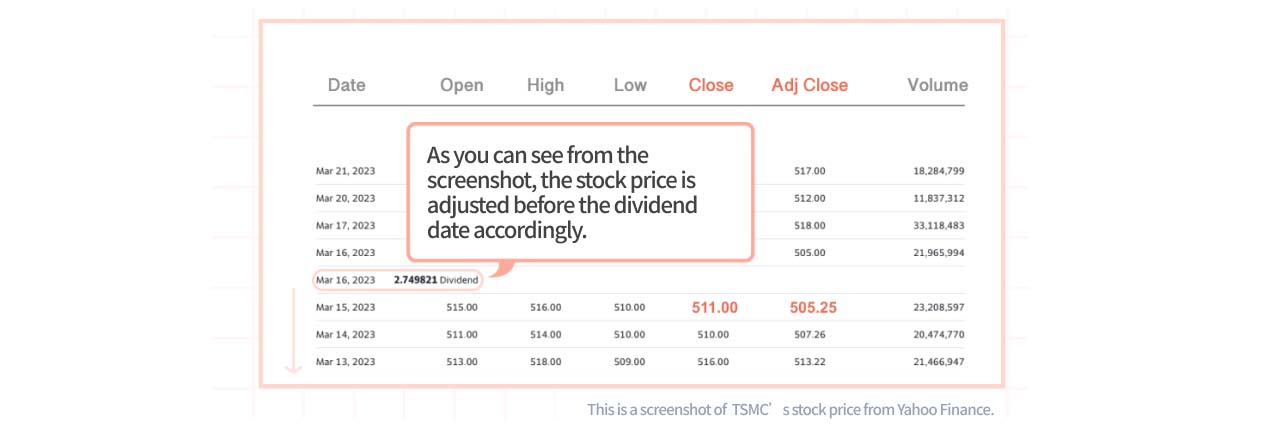
You might think calculating adjusted prices manually is cumbersome. Fortunately, most stock analysis platforms offer a "adjusted price" option. Simply select this option, and you’ll see a chart based on adjusted prices. You can easily determine the return from holding the stock over a specific period.
Adjusted stock price help investors directly see the true return from holding a stock. Hope everyone would have a better understanding of the value of adjusted stock price after reading this article!
