In our articles Financial Report 101: Introduction to Earnings Per Share (EPS) and Financial Report 101: Introduction to the Income Statement, we introduced the ideas of analyzing a company's profitability. However, you might still be wondering what the reasonable stock price is or how the market evaluates a stock's value.
At this point, we enter the realm of stock valuation, where an important indicator, the Price-to-Earnings Ratio (P/E Ratio), becomes essential.
What is the P/E Ratio
Composition and Meaning of the P/E Ratio
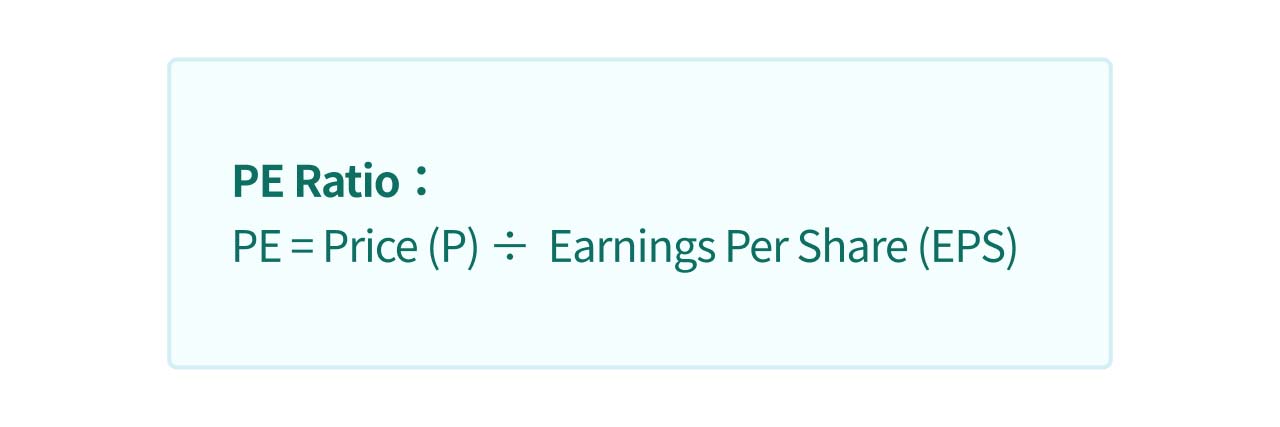
The P/E Ratio is fundamentally the ratio of Price (P) to Earnings Per Share (EPS). It combines market data with accounting information, offering a perspective on how the market views a company's performance. Essentially, P/E Ratio indicates how much investors are willing to pay for each unit of earnings the company generates.
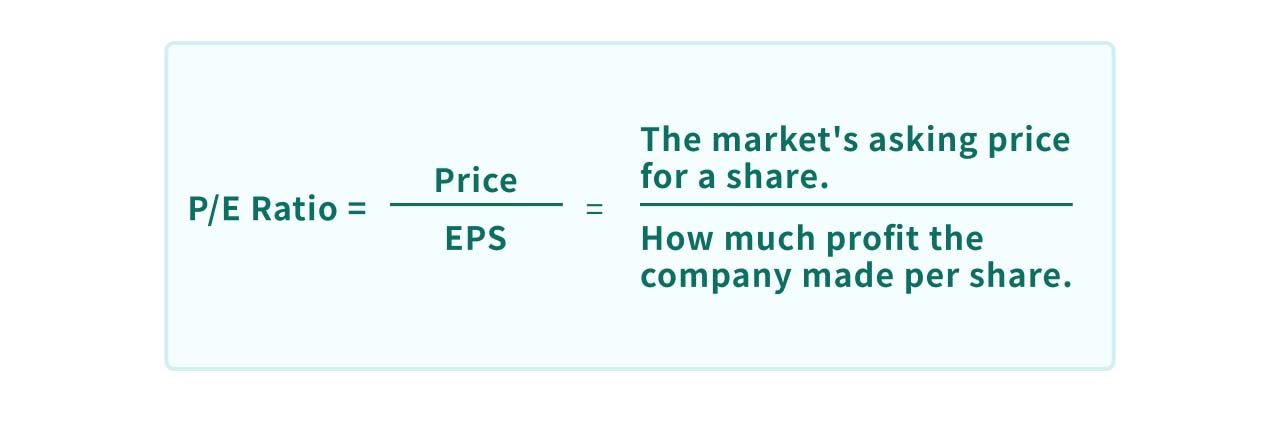
For Example, if stock A closes at $100, and its latest quarterly EPS is $5, the P/E ratio would be 20. This implies that for every dollar the company earns per share, the market is willing to pay 20 times that amount.
In practice, the P/E ratio is often compared against industry averages:
- If a company's P/E is significantly higher than the industry average, it may indicate the stock is overvalued.
- Conversely, a lower P/E may suggest the stock is undervalued, presenting a potential bargain.
Additionally, the P/E ratio inherently reflects a "payback period". For instance, if an investor buys stock A for $100, expecting an annual EPS of $5, it will take 20 years to recoup the investment. Hence, higher P/E ratios generally reflect longer payback times, while lower P/E ratios suggest quicker returns.
Advanced Insights of the P/E Ratio
Growth Factor Embedded in the P/E Ratio
Why would investors pay a higher price for relatively lower earnings? This is where growth potential comes into play.

When a company's growth prospects are strong, investors anticipate its stock price to rise in the future, creating a rush to "get in early," thus driving up the stock price. In this sense, the P/E ratio reflects market sentiment about the company's potential growth.
- High P/E industries often include technology and IC design sectors. These industries often have highly volatile revenue but a significant growth potential.
- Conversely, low P/E companies often represent industries with limited growth prospects or steady revenue. These companies tend to be found in more stable sectors like utilities and consumer goods.
Other Variants of the P/E Ratio
While the basic structure of the P/E ratio is simple, there are several variations in practice. For instance, using "forecasted EPS" offers a better reflection of future performance, and adjusting for inflation or seasonal factors can provide a more accurate Shiller P/E Ratio. Investors interested in deeper analysis should explore these variations.
P/E Ratio Sample: Nan Ya PCB Corporation
To better understand how the P/E ratio functions, let's look at an example using Nan Ya PCB Corporation (8046), one of Taiwan's leading companies in ABF substrate production.
Nan Ya PCB (8046) Overview
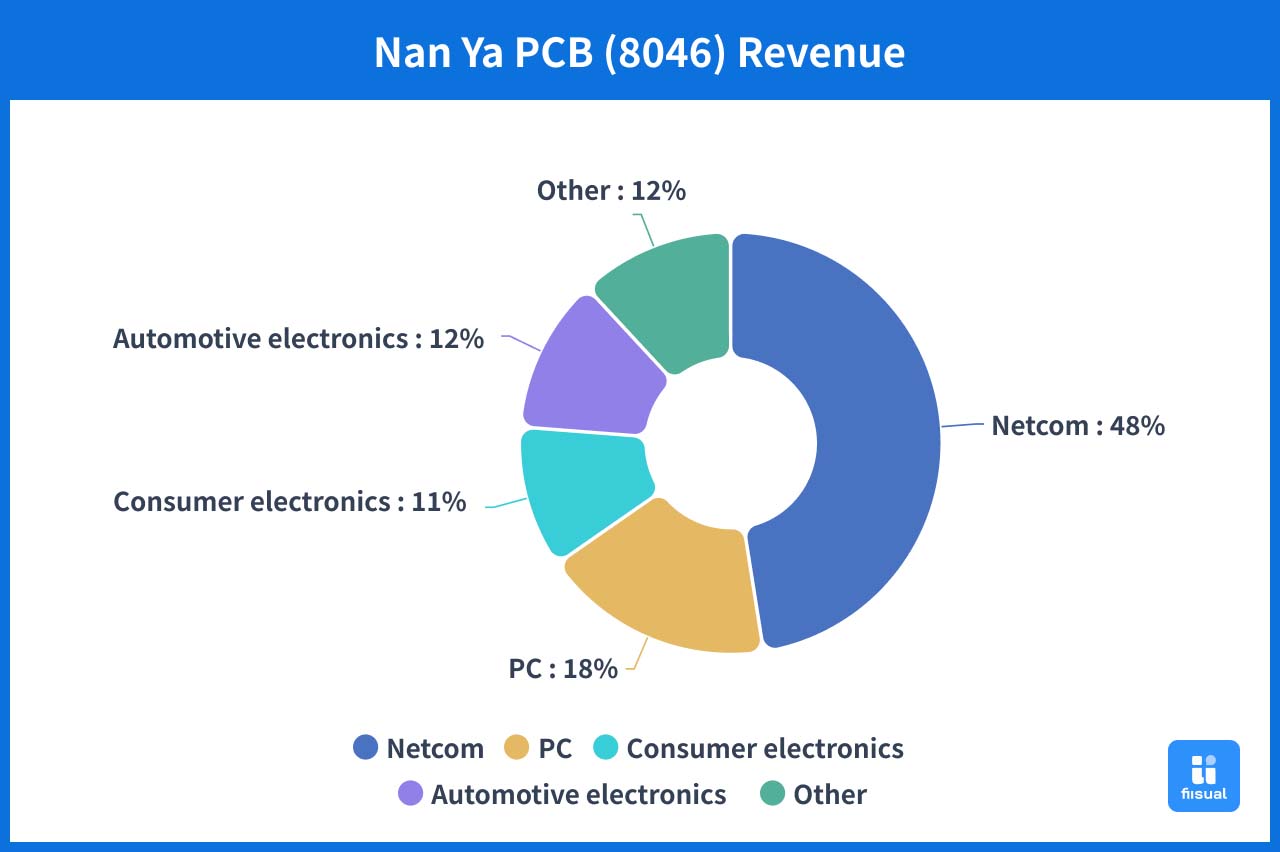
Nan Ya PCB, a subsidiary of Nan Ya Plastics, became an independent company in 1997. The company mainly produces ABF substrates, BT substrates, and HDI boards. The applications for these products are in PCs, telecommunications, consumer electronics, and automotive electronics. Among all of the applications, the telecommunications sector generates the largest share of revenue.
High P/E During Growth Phase
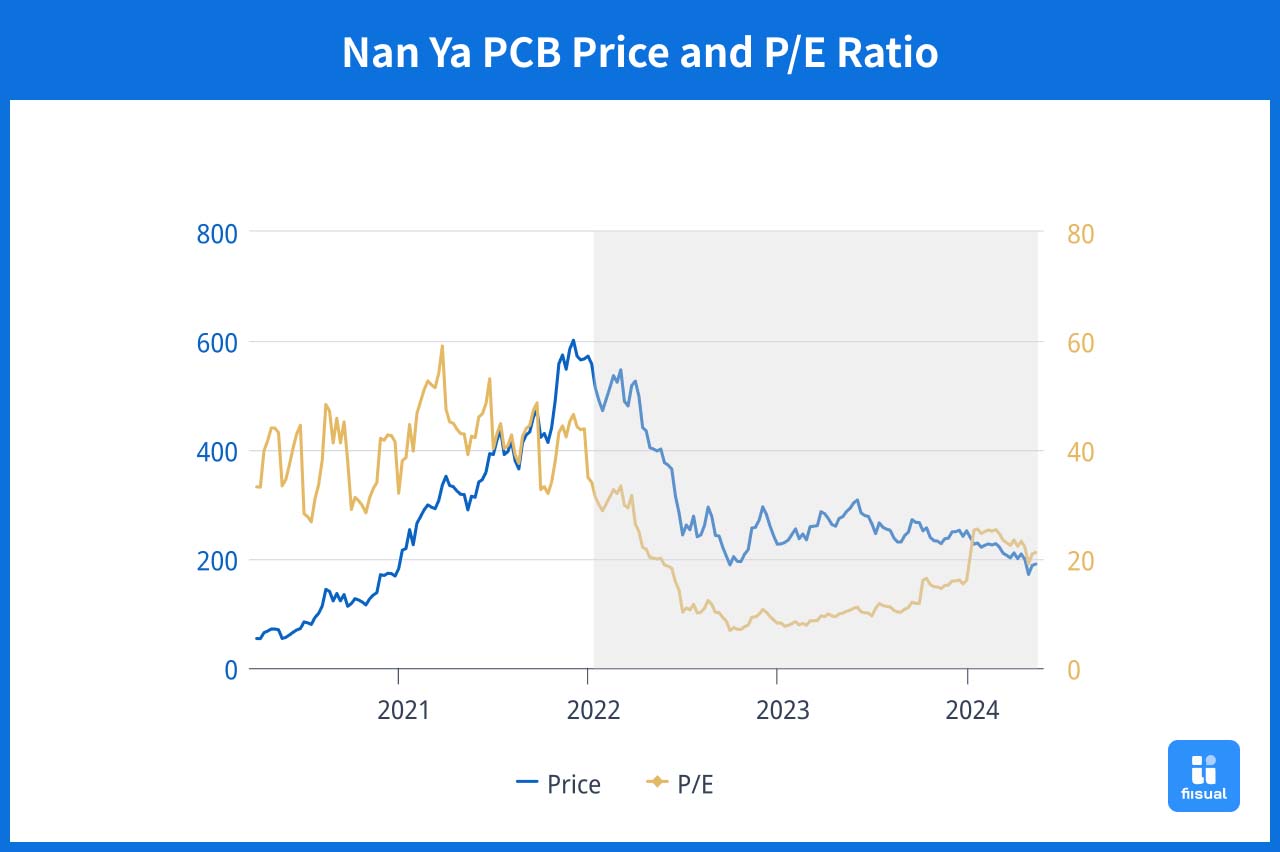
From 2020 to 2021, Nan Ya experienced a dramatic surge in stock price, jumping over tenfold, reaching around NT$630 at its peak. This was due to a massive spike in demand for consumer electronics, PCs, and 5G-related products, as well as the need for data centers and high-performance computing. Orders for ABF substrates were booked solid through 2024, boosting the stock price to incredible highs.
Decline as Growth Slows and P/E Adjusts
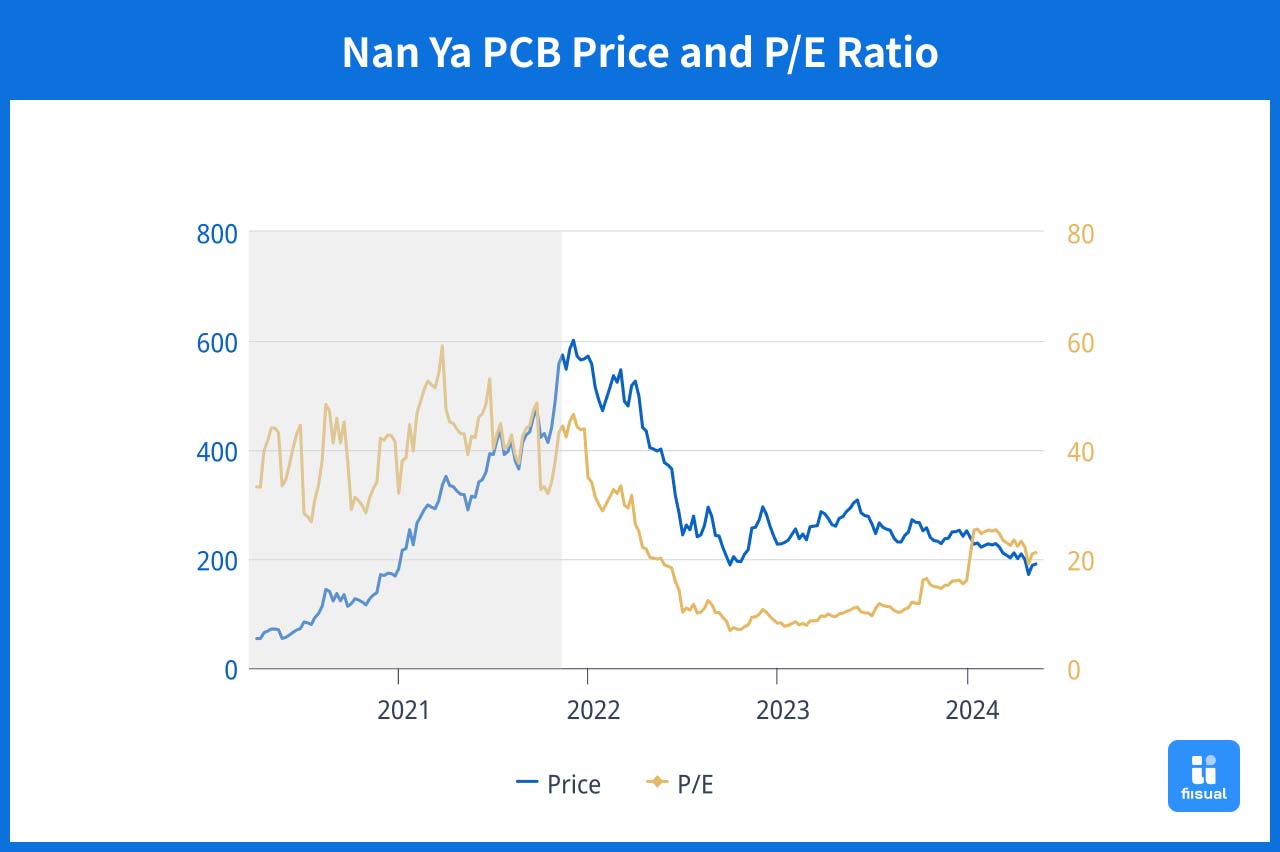
However, by 2022, the growth momentum began to slow. As the one-time equipment upgrade demand began to fade, and markets for PCs, servers, and smartphones shifted from supply shortage to overcapacity, sales started to decline. Furthermore, as production capacity expanded, the once-booming ABF substrate sector began accumulating inventory, leading to a decline in turnover since 2022. The market began to question the company's future growth potential.
Interplay Between P/E and EPS
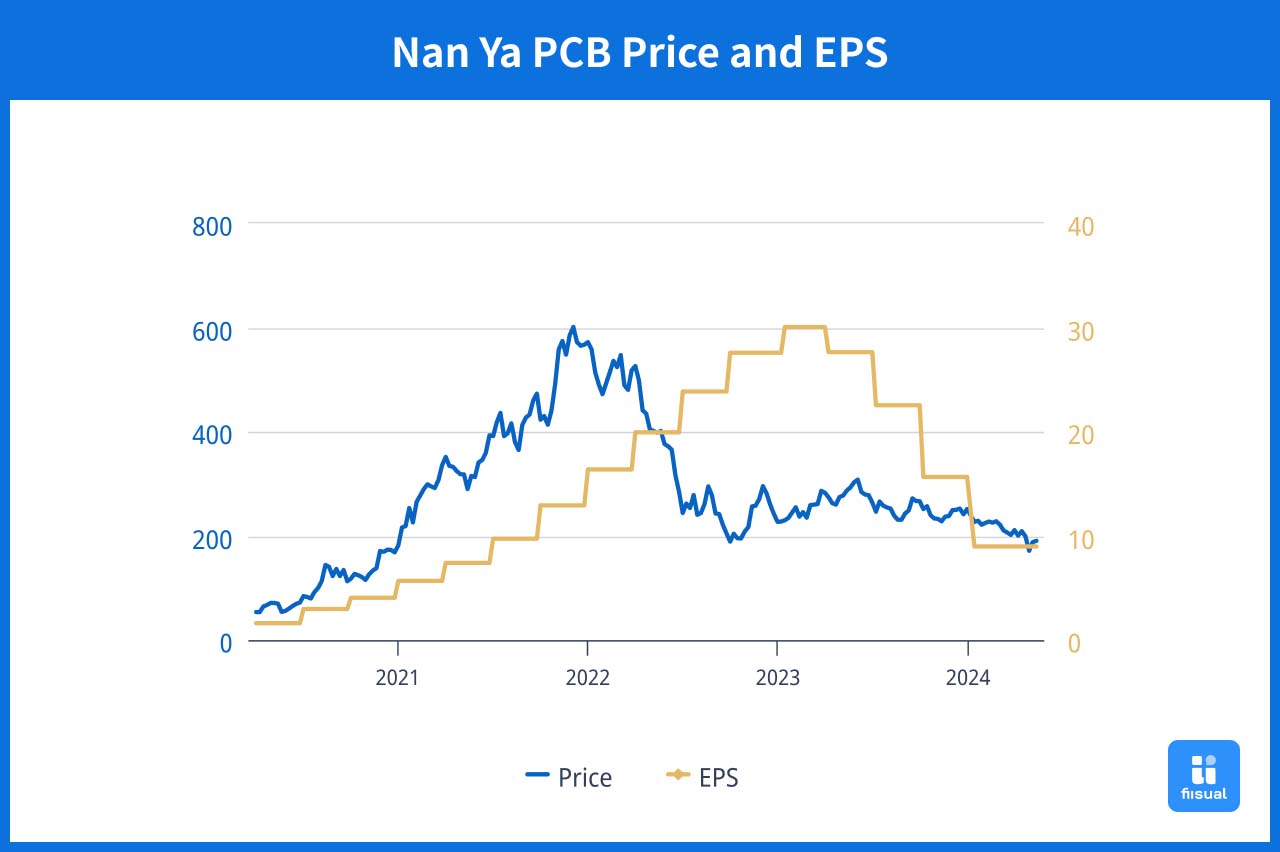
Between 2020 and 2021, Nan Ya's robust growth led to a P/E ratio of around 40 to 60, reflecting market optimism. However, by mid-2022, despite having rising EPS, the stock price gradually declined, and the P/E ratio dropped to the range of 9 to 12. This case illustrates how market valuation, driven by growth expectations, plays a crucial role in stock performance. Even when earnings continue to rise, a declining growth outlook can cause P/E ratios—and thus stock prices—to fall.
Nan Ya’s story is echoed by other ABF substrate producers such as Unimicron Technology (3037) and Kinsus Interconnect Technology (3189), which exhibited similar patterns during the same period. For investors who are interested about the P/E ratio in this case may want to explore these companies as further reference, too.
By understanding P/E ratios and how they reflect market sentiment, growth potential, and industry trends, we hope that you can better assess the value of stocks and make informed decisions.
