Components of a Candlestick
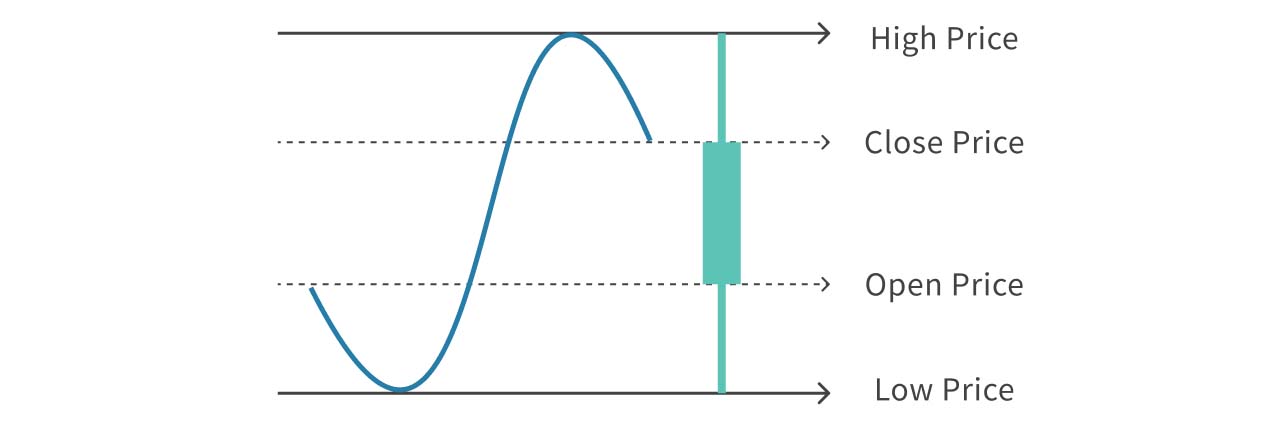
Candlestick as a Condensed Representation of Price Movements
A candlestick chart is mainly composed of four key pieces of information: the opening price, closing price, lowest price, and highest price. With these four pieces of market information, we can draw a candlestick. Due to its resemblance to a candle, it is commonly referred to as a "candlestick" , and the chart made up of multiple candlesticks is called a "candlestick chart."
As a single candlestick include four important price points, we can quickly get an overview of price movements over a period of time by interpreting the candlestick. To help traders quickly identify price trends, different colors (typically red or green) are used to differentiate price movements during the period.
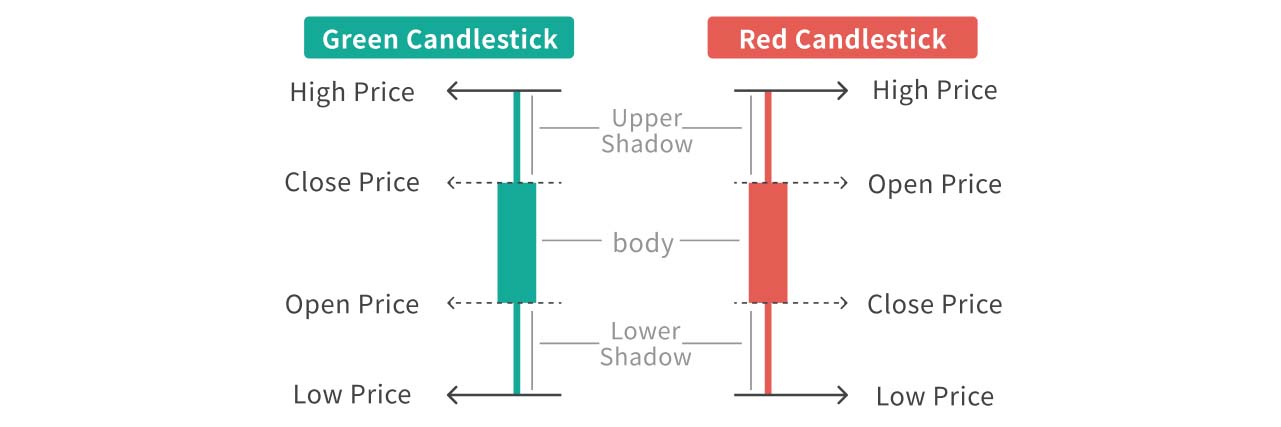
Usually on foreign websites, if the closing price during a period is higher than the opening price, the candlestick will appear green. Conversely, if the closing price is lower than the opening price, the candlestick will appear red.
- Red indicates a price decrease during the period (closing price lower than opening price)
- Green indicates a price increase during the period (closing price higher than opening price)
Intuitive Information from Candlesticks: Price Volatility
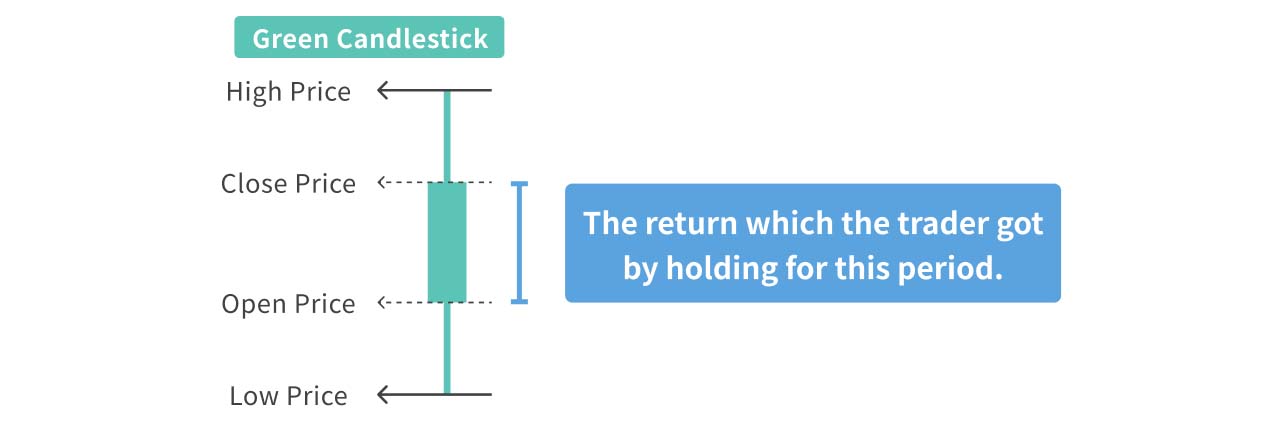
From the length of the candlestick real body, we can see the extent of price changes from opening to closing. The longer the real body, the greater the profit or loss for traders who held from open to close.
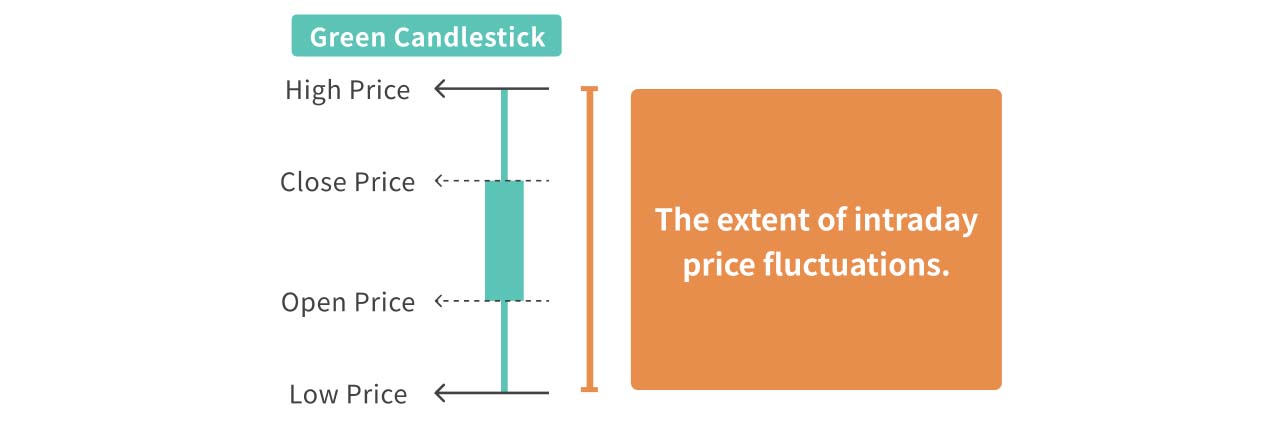
Additionally, by looking at the length of the upper and lower shadows, we can gauge the extent of intraday price fluctuations. The longer the shadows, the greater the intraday volatility.
After introducing the information contained in a candlestick, let's move on to discuss some common candlestick patterns!
Three Common Candlestick Patterns
How to Quickly Identify the Information Candlesticks Might Convey
Understanding that candlesticks are condensed representations of trading information, we can see why analyzing candlestick patterns can provide a snapshot of the market’s trading activity at the time. We categorize candlestick patterns into three broad types and offer a quick guide to understanding the basic meanings behind each.
Pattern 1: Standard Candlestick
Relatively Long Real Body with Short Upper and Lower Shadows
A standard candlestick features a body with upper and lower shadows, where the shadows are relatively short. This pattern indicates that although there were price fluctuations during the period, the closing price returned to a relatively neutral position, and the retracement or consolidation did not significantly impact the overall price trend during the period.
Since the candlestick simplifies the price movement over the period, we cannot discern the exact details of the price fluctuations. However, generally, a standard candlestick can be viewed as the price moving relatively normally from open to close.
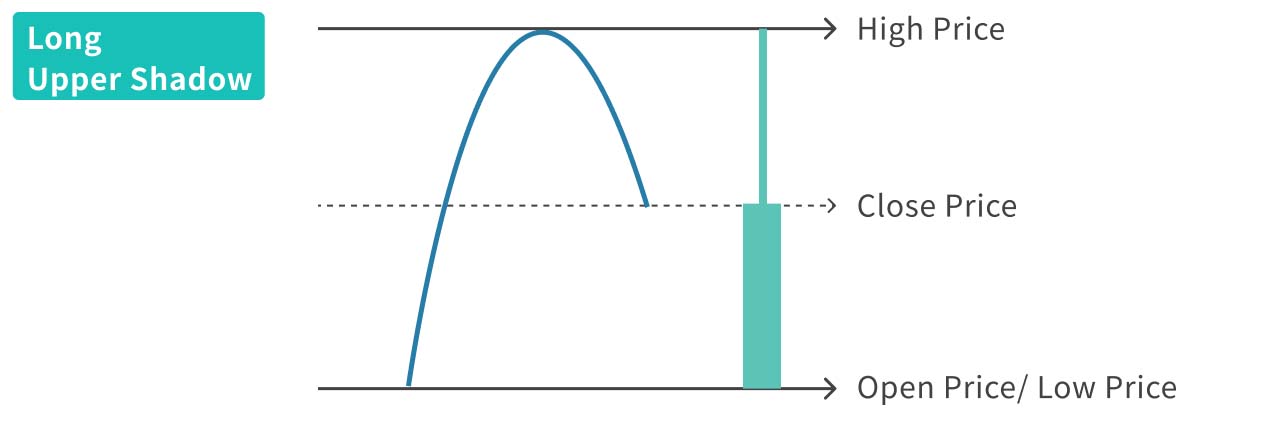
Pattern 2: Long Upper or Lower Shadows
Long Upper Shadow
Long Lower Shadow
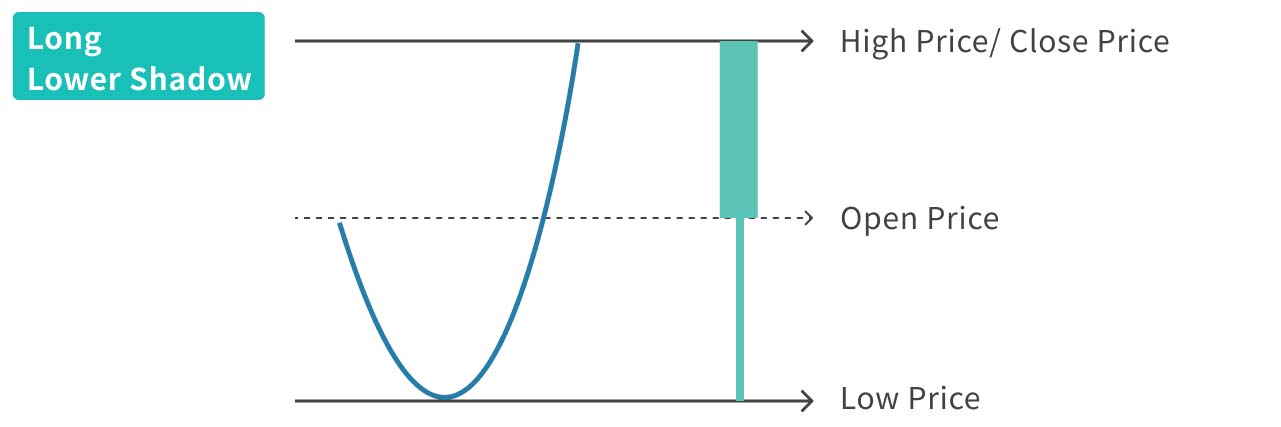
This type of candlestick suggests significant price reversals during the period. If the price rebounded sharply after hitting a low or fell sharply after reaching a high, it would leave a long upper or lower shadow.
When a candlestick shows a long upper or lower shadow, using only the body of the candlestick to judge price movements may not be sufficient, as the shadows indicate that the price moved in different directions during the trading period. Traders should then pay attention to whether the price trend is likely to reverse.
Pattern 3: No Upper or Lower Shadow
Almost No Upper or Lower Shadow
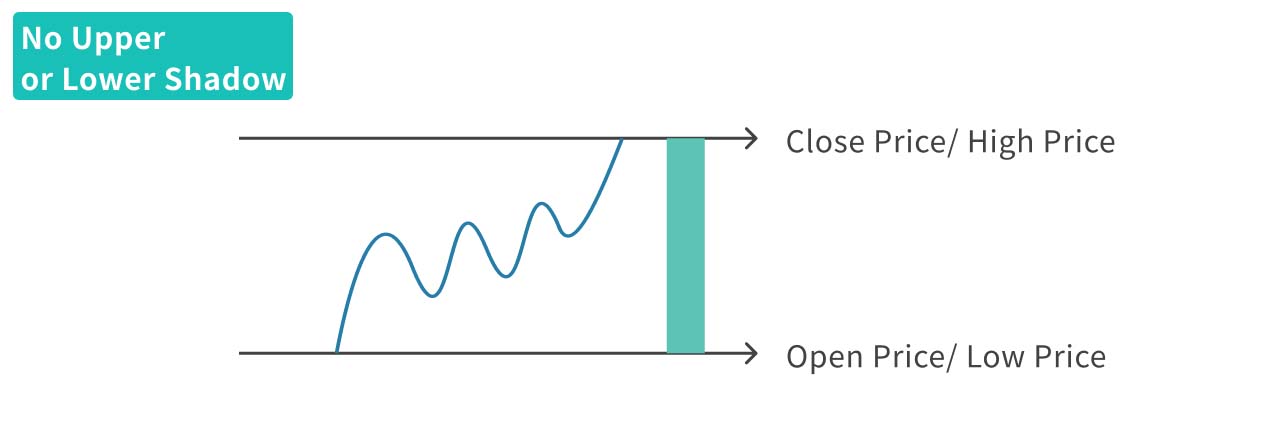
A candlestick with no upper or lower shadow conveys relatively simple information: the price showed a consistent directional movement during the period. Although there may have been minor fluctuations, they did not exceed the final open and close prices, hence no shadows were left.
Other Candlestick Patterns
In addition to the types mentioned above, technical analysts often further categorize candlesticks by color (red or green) and other specific patterns to refine their investment strategies.
Summary
Candlesticks mainly include four key pieces of information: open price, close price, lowest price, and highest price.
- Candlestick body: represents the profit or loss for traders from open to close.
- Upper and lower shadows: indicate the extent of intraday price fluctuations.
The three common candlestick patterns:
- Standard: indicates some fluctuation during the period but with a closing price that consolidates.
- Long upper and lower shadows: indicates significant reversals during the period, may need to pay attention to potential trend reversals.
- No shadows: indicates consistent price movement in one direction with minimal fluctuation.
