Given the Federal Reserve's target interest rate’s significant global impact—from market liquidity and funding costs to the pricing of various goods—the market closely monitors future rate expectations. The FedWatch tool is an excellent resource for investors, providing a straightforward forecast of future interest rates to help guide investment decisions. Are you curious about how to use FedWatch tool and apply its insights. Below we will introduce the basic function and meanings together.
What is FedWatch Tool
FedWatch tool is developed by the Chicago Mercantile Exchange (CME Group) to forecast the probability of Federal Reserve rate decisions.
The tool is based on the "30-Day Federal Funds" futures contract listed on CME Group, which is calculated based on the Effective Federal Funds Rate (EFFR)—the actual rate on which the Fed tries to exert indirect control. Given futures contracts’ predictive pricing, traders often make bets on rate changes in periods of high volatility, allowing the trading price to reflect market expectations. Since the futures price alone may be difficult to interpret, CME Group converts prices into probabilities for rate hikes or cuts, making it more accessible for market participants.
How to Use FedWatch Tool
In 2024, the market is particularly focused on how many rate cuts might occur, and these can be understood through two perspectives: market expectations and officials' projections. Here’s a step-by-step guide to navigate through FedWatch Tool.
Market Expectations: Short-Term Rate Observation
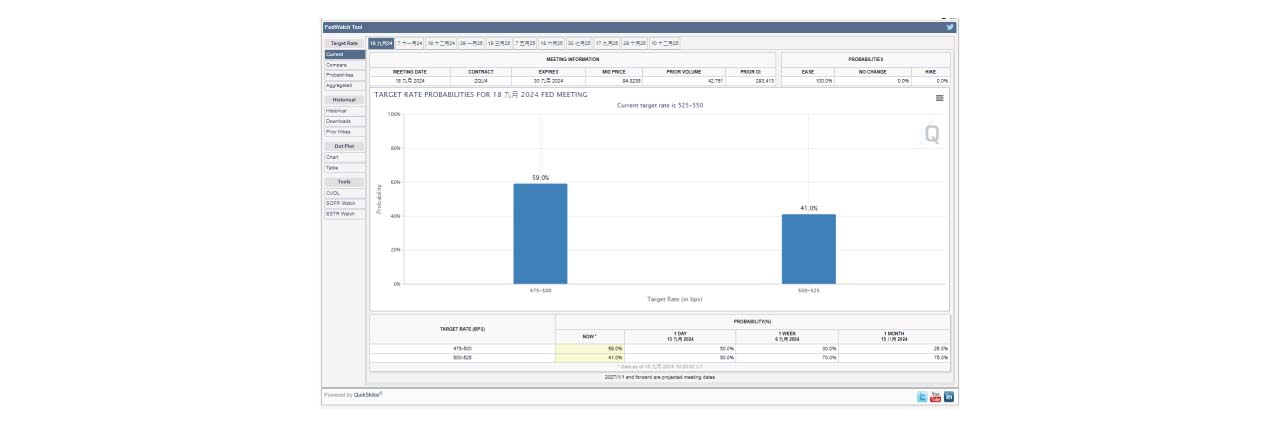
On the [Current] tab of the FedWatch tool, you can select an upcoming FOMC meeting, such as the one on September 24. As an example, the current probability of a post-meeting rate of 5.00% - 5.25% is 41%. Since the current rate is 5.25% - 5.50%, this probability represents a 41% chance of a quarter-point rate cut.
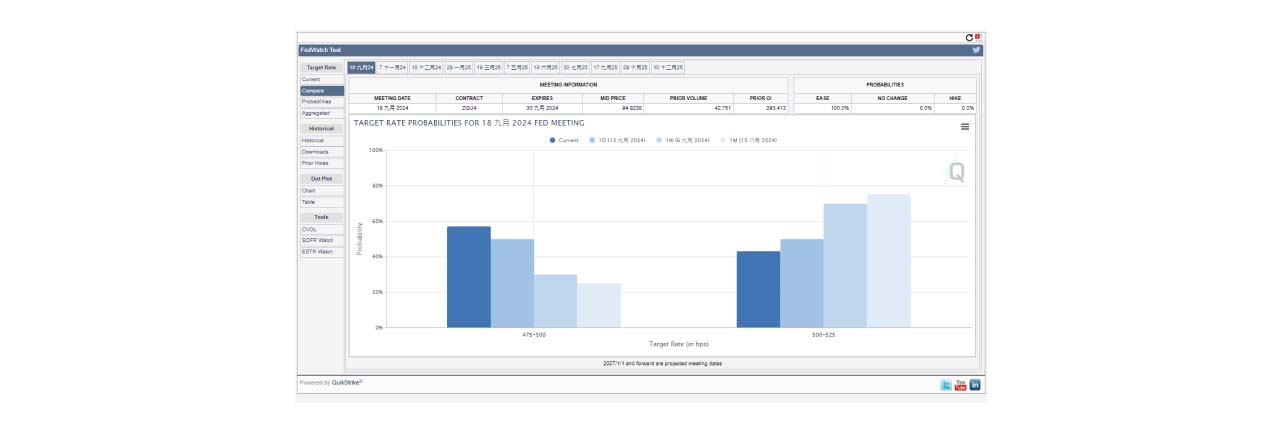
Once you understand the market consensus, you can further analyze changes in market sentiment. The table below shows changes in the probability of rate cuts over the past day, week, and month, where you may notice an increasing probability of a double rate cut. For a clearer view, click on [Compare] to observe trends in rate expectations over time.
Market Expectations: Long-Term Rate Observation
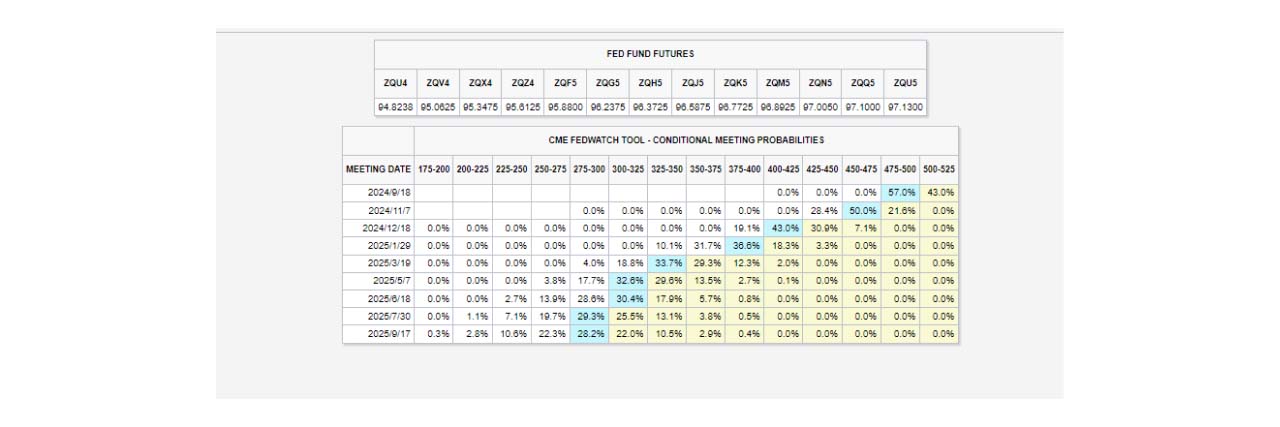
Futures contracts are available with short-term and long-term expiries, allowing users to monitor long-term rate trends. By selecting [Probabilities] , you can view the expected path for rates over time.
The blue bars represent the most likely rate at a given time; for example, a 4.75% - 5.00% rate is most probable on September 18, and a 4.50% - 4.75% rate on November 7. These values reflect the market’s expectations for future rate trends.
Official Projections: Dot Plot
Beyond market reactions to economic events, the perspectives of Fed officials are also important. FedWatch Tool allows users to view the dot plot, which reflects Fed officials’ views on long-term interest rates.
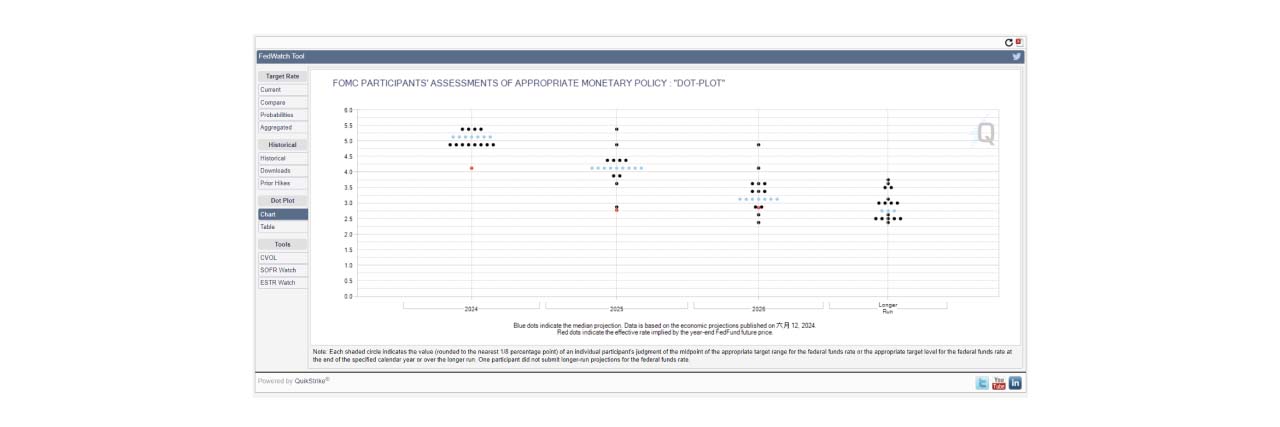
To interpret the dot plot, look for the median position—the light blue dots—to identify the most probable rate decisions. The plot provides an outlook for the next three years, while the red dots represent market expectations of rate decisions. Dot Plot Interpretation: Each official provides their forecast, so the median reflects the central tendency. However, the median might still differ from the opinions of final voting members with the decision making power.
Is the Prediction Accurate?
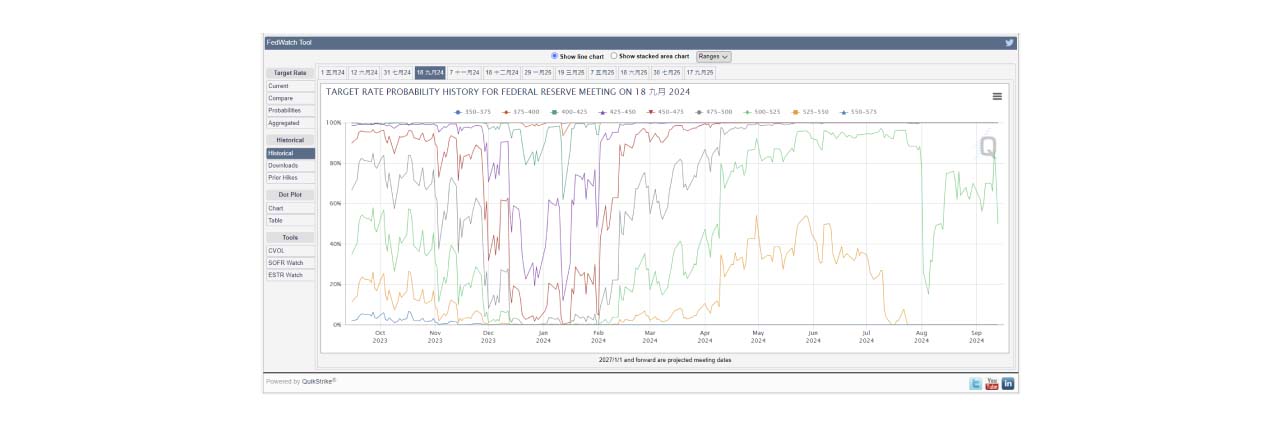
Probability forecasts are continuously updated and can fluctuate significantly within a single day due to official statements or economic data releases. Calculated daily based on futures prices, probabilities may not always give a market-leading view. However, it is valuable for tracking current market consensus and helping investors adjust strategies ahead of potential shifts in rate policy. This makes the FedWatch Tool a very useful monitoring tool!
For more information, you may visit the official website CME FedWatch Tool
